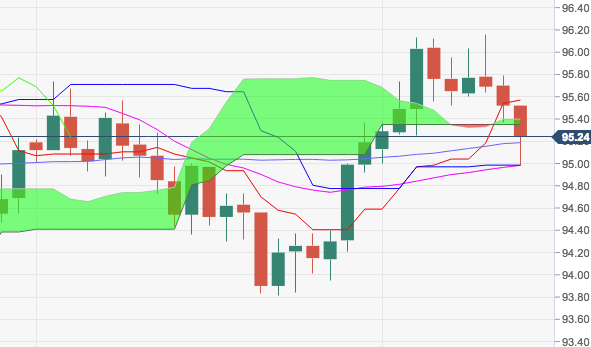
- DXY keeps correcting lower after failing to advance further north of recent tops beyond the 96.00 milestone earlier in the week.
- The 21-day SMA at 94.95 held the selling impetus so far. This area of support appears reinforced by the 100-day SMA at 94.86
- The continuation of the downside could see the 38.2% Fibo retracement of the 2017-2018 drop at 94.20 tested.
- In the meantime, the index should keep the constructive bias unchanged above 93.71, July’s low.
DXY daily chart
Dollar Index Spot
Overview:
Last Price: 95.28
Daily change: -24 pips
Daily change: -0.251%
Daily Open: 95.52
Trends:
Daily SMA20: 94.97
Daily SMA50: 95.24
Daily SMA100: 94.85
Daily SMA200: 92.74
Levels:
Daily High: 95.79
Daily Low: 95.37
Weekly High: 96.13
Weekly Low: 95
Monthly High: 96.13
Monthly Low: 93.81
Daily Fibonacci 38.2%: 95.53
Daily Fibonacci 61.8%: 95.63
Daily Pivot Point S1: 95.33
Daily Pivot Point S2: 95.14
Daily Pivot Point S3: 94.91
Daily Pivot Point R1: 95.75
Daily Pivot Point R2: 95.98
Daily Pivot Point R3: 96.17
