- GBP/USD is trading in a bull trend as the market is above the 200-simple moving average.
- GBP/USD met some resistance near the 1.3259 level. GBP/USD is set to consolidate lower towards 1.3100 as the market had a sharp pullback down near a key level at 1.3300 figure. Spikes to 1.3200 might happen before the pullback down enters into play.
- A strong bull breakout above 1.3259 on a daily close basis would lead to a continuation of the bull trend.
GBP/USD 4-hour chart
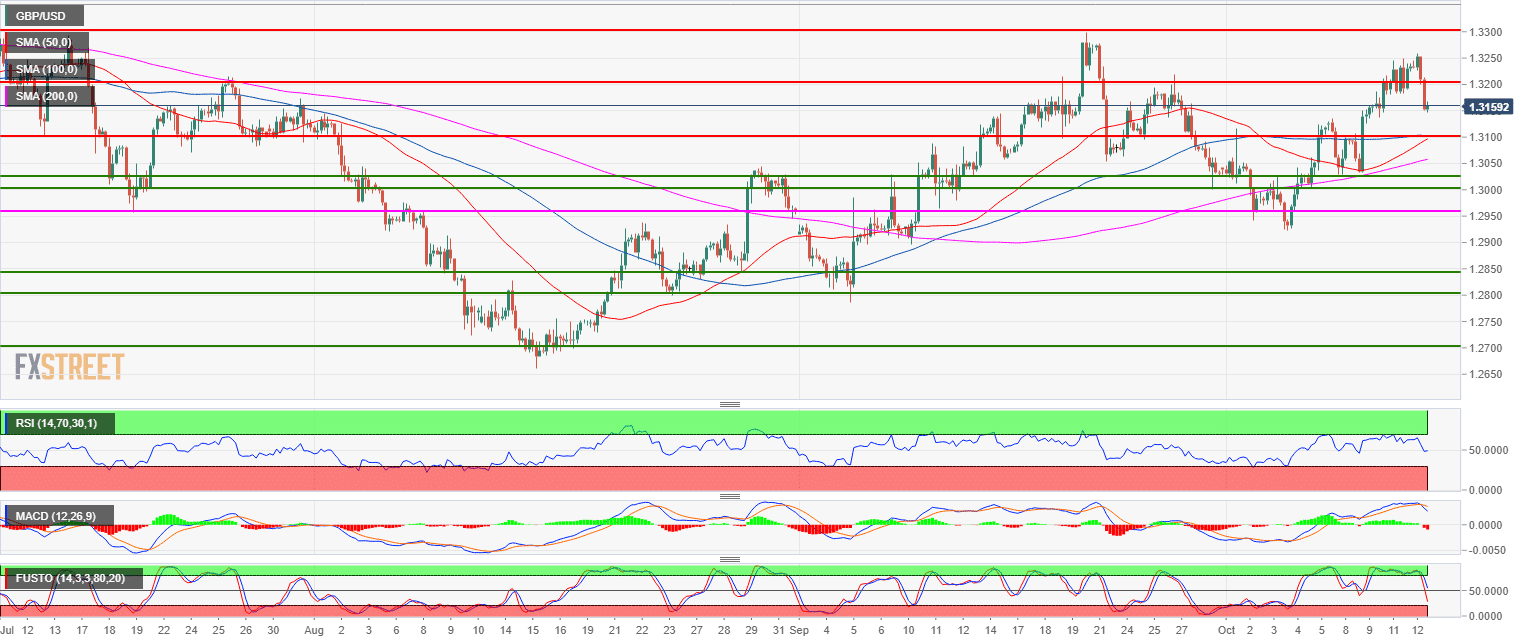
Spot rate: 1.3156
Relative change: -0.58%
High: 1.3259
Low: 1.3146
Main trend: Bullish
Resistance 1: 1.3200 figure
Resistance 2: 1.3259 October 12 high
Resistance 2: 1.3300 September 20 high
Resistance 3: 1.3370 July 9 high
Resistance 4: 1.3400 figure
Support 1: 1.3150 September 21 low
Support 2: 1.3100 figure
Support 3: 1.3050 August 30 swing high, key level
Support 4: 1.3028 October 8 low
Support 5: 1.3000 figure
Support 6: 1.2957 July 19 swing low
