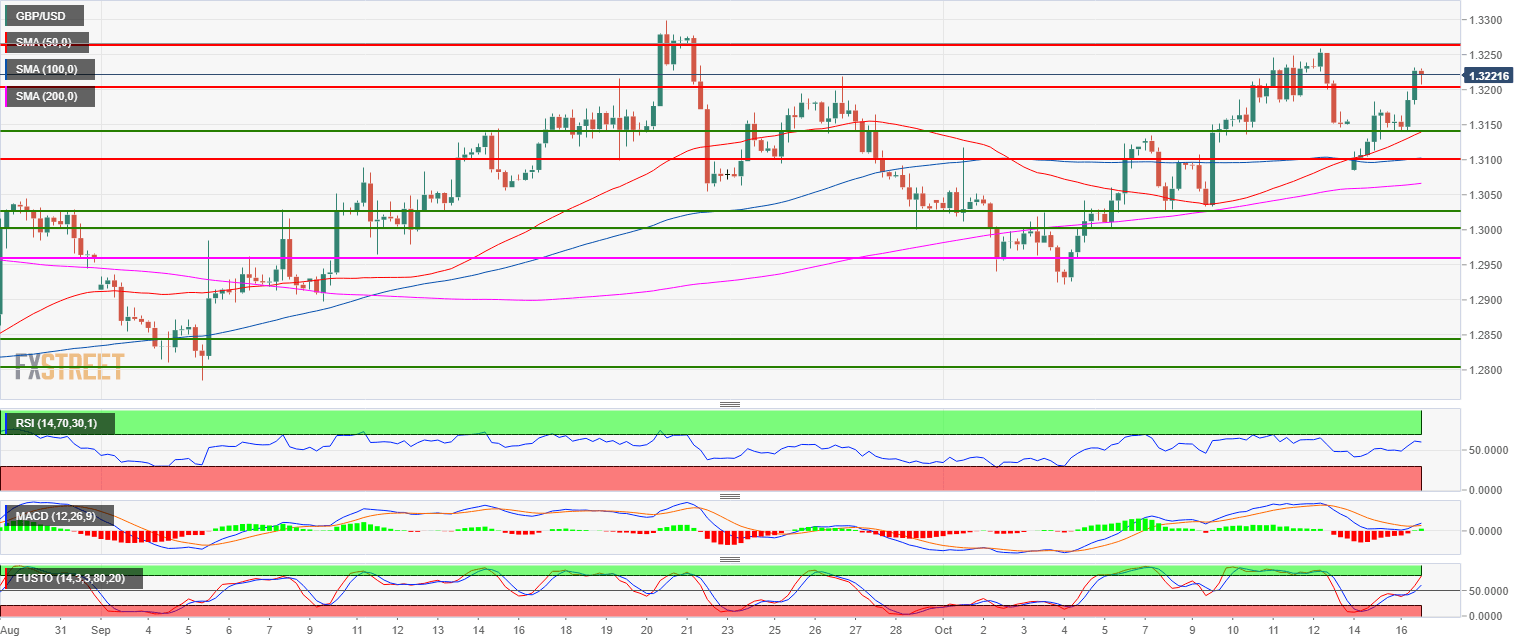
- GBP/USD is in a bull trend above the 200-period simple moving average.
- GBP/USD broke above the 1.3200 level and is currently in a small pullback from recent daily highs. The bull trend remains intact as the RSI, MACD and Stochastic indicators are all bearishly configured. The next objective for bulls will be to reach 1.3259 (October 12 high) to then travel towards 1.3300. Support is seen near the 1.3200 figure and 1.3140 level (current October 16 low).
- A bear breakout below 1.3140 on a daily closing basis would be a warning signal for bulls.
Spot rate: 1.3228
Relative change: 0.58%
High: 1.3231
Low: 1.3140
Main trend: Bullish
Resistance 1: 1.3259 October 12 high
Resistance 2: 1.3300 September 20 high
Resistance 3: 1.3370 July 9 high
Resistance 4: 1.3400 figure
Support 1: 1.3200 figure
Support 2: 1.3140 current October 16 low
Support 3: 1.3100 figure
Support 4: 1.3050 August 30 swing high, key level
Support 5: 1.3028 October 8 low
Support 6: 1.3000 figure
Support 7: 1.2957 July 19 swing low
