- USD/CAD is trading below its 50, 100 and 200-period simple moving averages (SMA) suggesting that the momentum is currently bearish.
- USD/CAD is dropping towards 1.2924 (October 10 low). It will remain to be seen if the bulls will step in to support the market. At this stage, nothing indicates that the bearish momentum should abate. The RSI, MACD and Stochastic indicators are bearishly configured suggesting that further losses can be on the cards.
- A break below 1.2924 can open the gates to 1.2882-1.2900 zone (September 20 low and figure).
USD/CAD 4-hour chart
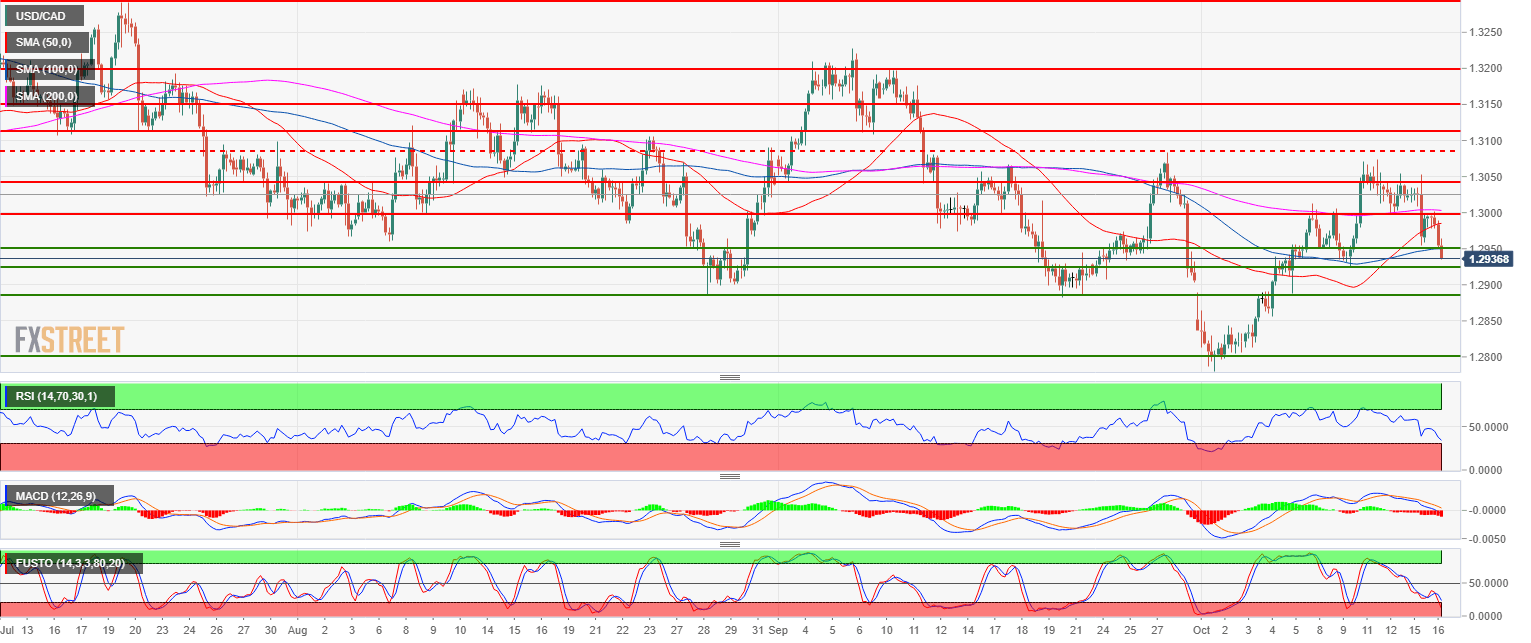
Spot rate: 1.2936
Relative change: -0.41%
High: 1.3000
Low: 1.2936
Main trend: Neutral
Short-term: Bearish
Resistance 1: 1.2950-59 multi-month key level and August 7 low
Resistance 2: 1.3000 figure
Resistance 3: 1.3048 August 14 low
Resistance 4: 1.3083 September 27 swing high
Resistance 5: 1.3108, September 7 low
Resistance 6: 1.3200 figure
Support 1: 1.2924 October 10 low
Support 2: 1.2882-1.2900 zone September 20 low and figure
Support 3: 1.2855-65 June 6 low – 200-day SMA
Support 4: 1.2800 figure
Support 5: 1.2727 May 11 low
