Home GBP/USD Technical Analysis: Cable is back down below 1.3200 figure as bulls take a breather
FXStreet News

GBP/USD Technical Analysis: Cable is back down below 1.3200 figure as bulls take a breather

  • GBP/USD is in a bull trend above the 200-period simple moving average.
  • GBP/USD has rejected the 1.3200 figure  suggesting that the market might enter a consolidation phase below the level.  
  • Failure to recapture 1.3237 (the current October 16 high) can lead to a pullback down towards 1.3140 (current October 16 low) in the coming sessions.
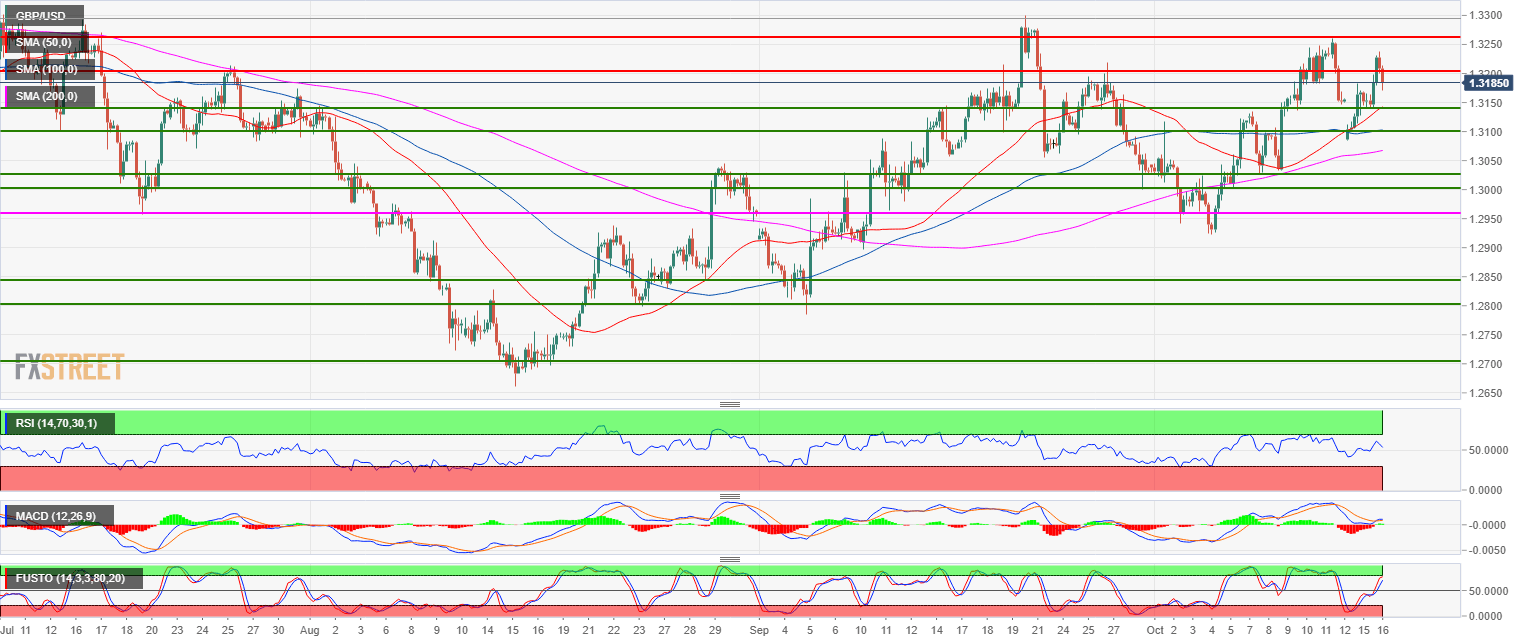
GBP/USD 4-hour chart

Spot rate:                         1.3184
Relative change:              0.24%      
High:                                1.3237
Low:                                 1.3140

Main trend:                      Bullish

Resistance 1:                  1.3200 figure
Resistance 1:                  1.3259 October 12 high
Resistance 2:                  1.3300 September 20 high
Resistance 3:                  1.3370 July 9 high
Resistance 4:                  1.3400 figure

Support 1:                      1.3140 current October 16 low
Support 2:                      1.3100 figure
Support 3:                      1.3050 August 30 swing high, key level
Support 4:                      1.3028 October 8 low
Support 5:                      1.3000 figure  
Support 6:                      1.2957 July 19 swing low  
 

FX Street

FX Street

FXStreet is the leading independent portal dedicated to the Foreign Exchange (Forex) market. It was launched in 2000 and the portal has always been proud of their unyielding commitment to provide objective and unbiased information, to enable their users to take better and more confident decisions.