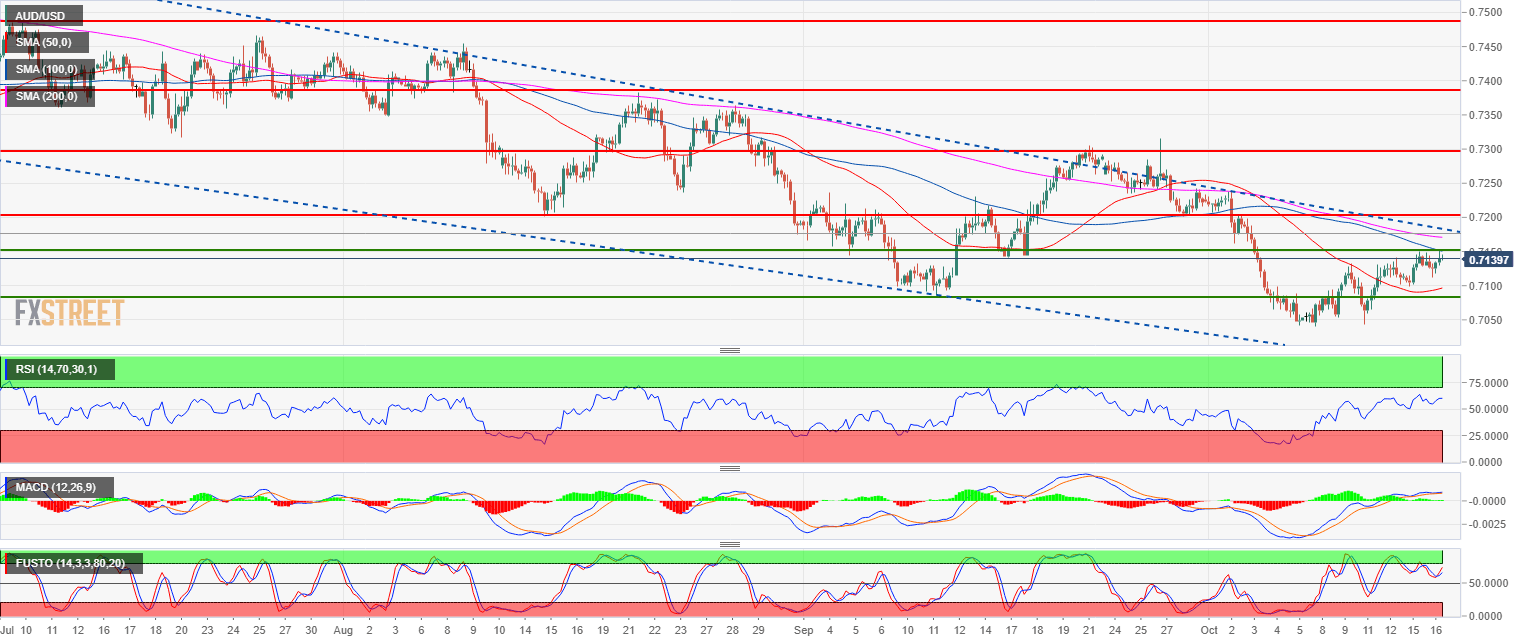
- AUD/USD is in a bear trend below the 200-period simple moving average (SMA). AUD/USD is in the midst of a pullback up as the bulls are trying to break above the 0.7144 resistance (September 5 low).
- The RSI, MACD and Stochastic indicators are constructive for further gains in the coming sessions. Bulls need the break above 0.7144 in order to reach 0.7174-0.7200 zone (the 200 SMA on the 4-hour chart and August 15 low.
- On the flip side, A bear break below 0.7100 on a daily closing basis would be seen as potentially bearish.
Spot rate: 0.7140
Relative change: 0.14%
High: 0.7152
Low: 0.7111
Main trend: Bearish
Short-term trend: Bullish above 0.7041
Resistance 1: 0.7144 September 5 low
Resistance 2: 0.7174-0.7200 zone, 200 SMA (4H) and August 15 low
Resistance 3: 0.7300 figure
Support 1: 0.7100 figure
Support 2: 0.7085, September 11 low
Support 3: 0.7041 October low
Support 4: 0.7000 figure
Support 5: 0.6830 January 15, 2016 low
