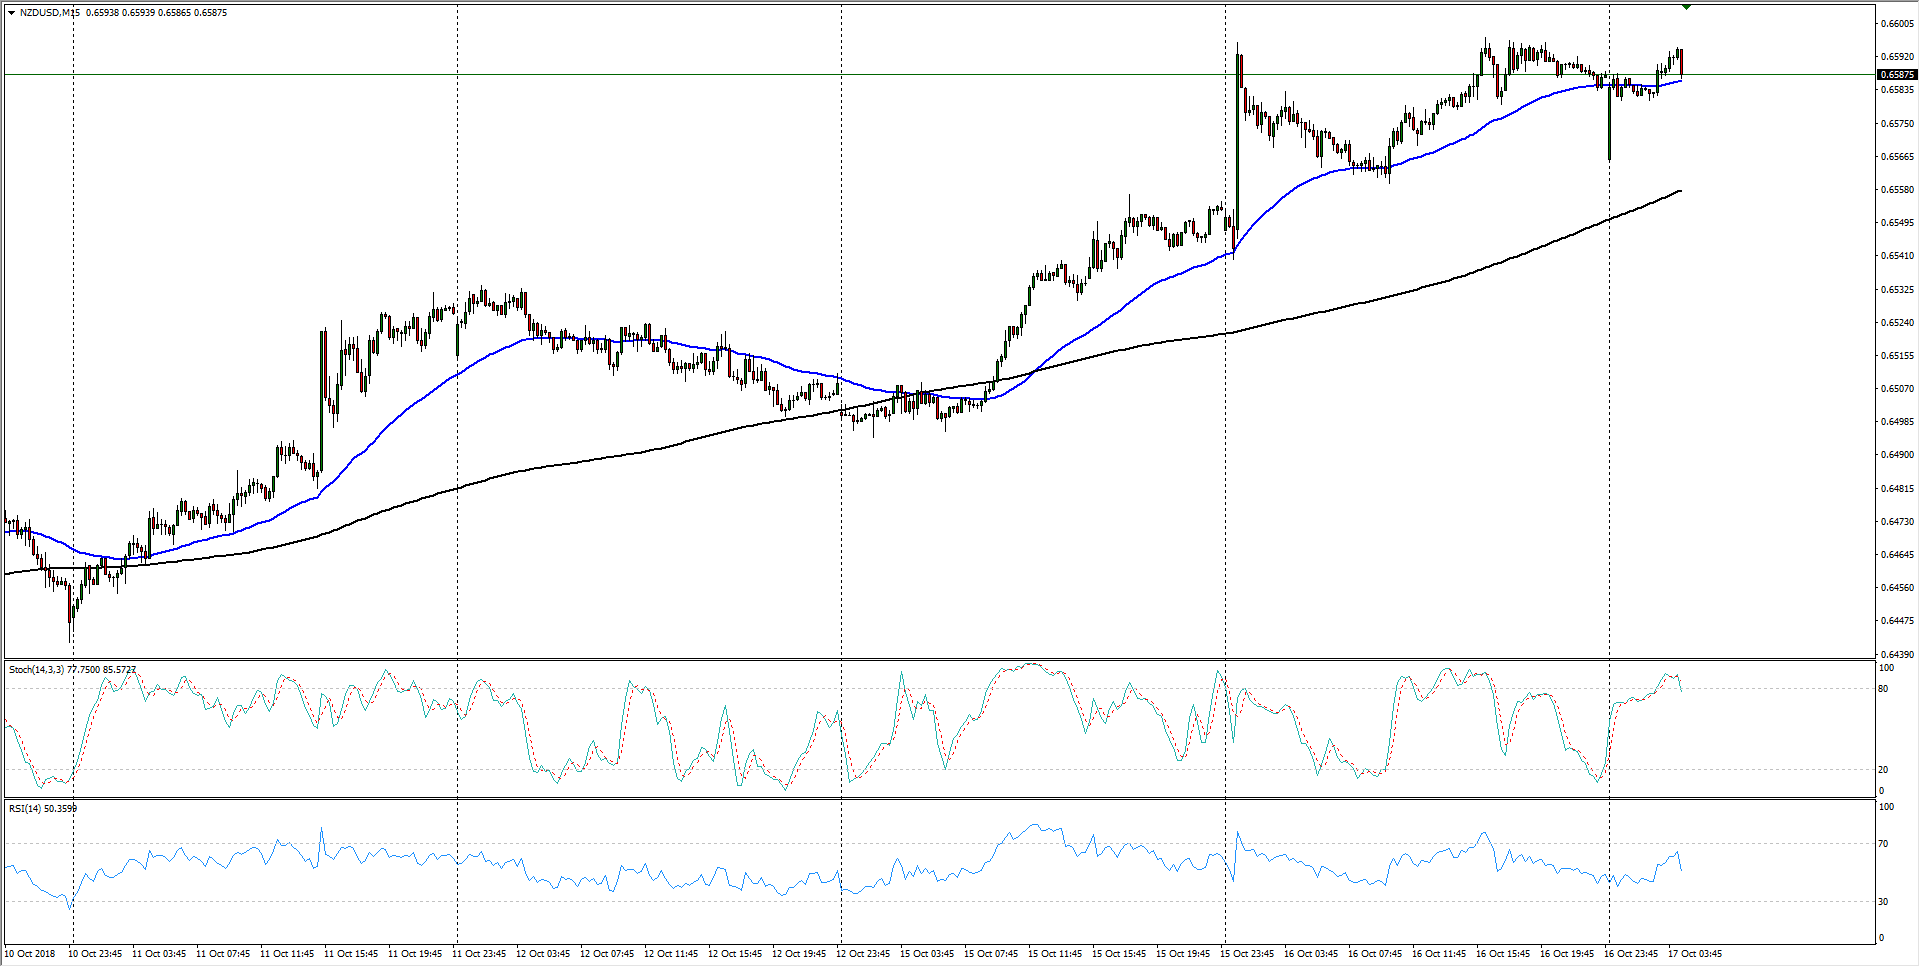
- The Kiwi is taking steady steps higher, bolstered by an improving economic outlook for the NZ domestic economy as well as a perfectly-timed step down for the Greenback.
- The current bullish move could see high-side challenges from the 200-period moving average on H4 candles, a level that the pair has recently crossed bove but now threatens a “magnet” effect.
- Long-term, the Kiwi remains constrained within a firm bearish downtrend on Daily candles, and the 50-day moving average is capping off gains at the 0.6600 level.
NZD/USD
Overview:
Last Price: 0.6594
Daily change: 8.0 pips
Daily change: 0.121%
Daily Open: 0.6586
Trends:
Daily SMA20: 0.6567
Daily SMA50: 0.6595
Daily SMA100: 0.6726
Daily SMA200: 0.6967
Levels:
Daily High: 0.6597
Daily Low: 0.6544
Weekly High: 0.6534
Weekly Low: 0.6424
Monthly High: 0.67
Monthly Low: 0.6424
Daily Fibonacci 38.2%: 0.6577
Daily Fibonacci 61.8%: 0.6564
Daily Pivot Point S1: 0.6554
Daily Pivot Point S2: 0.6522
Daily Pivot Point S3: 0.65
Daily Pivot Point R1: 0.6607
Daily Pivot Point R2: 0.6629
Daily Pivot Point R3: 0.6661
