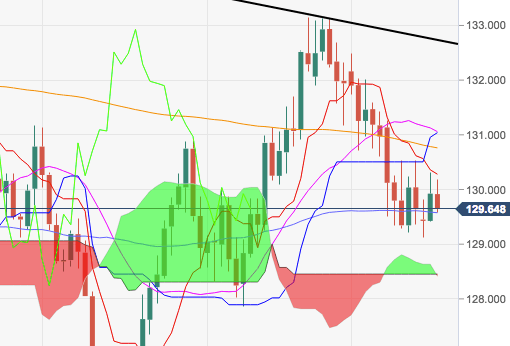
- EUR/JPY continues to trade in an erratic fashion so far this week, finding support in the 129.00 neighbourhood and with gains capped around the 200-day SMA, today at 130.75.
- A surpass of the 200-day SMA should open the door for a potential visit to the 21-day SMA just above 131.00 the figure.
- Further north, the cross needs to advance beyond the resistance line at 132.73 to allow for, initially, a test of September’s peaks beyond the 133.00 handle ahead of October 2017 tops in the mid-134.00s.
- However, as long as the resistance line above 132.70 caps the upside, a resumption of the downtrend should not be ruled out.
EUR/JPY daily chart
EUR/JPY
Overview:
Last Price: 129.66
Daily change: -26 pips
Daily change: -0.200%
Daily Open: 129.92
Trends:
Daily SMA20: 131.13
Daily SMA50: 129.62
Daily SMA100: 129.47
Daily SMA200: 130.81
Levels:
Daily High: 130.32
Daily Low: 129.41
Weekly High: 131.26
Weekly Low: 129.21
Monthly High: 133.15
Monthly Low: 129.21
Daily Fibonacci 38.2%: 129.97
Daily Fibonacci 61.8%: 129.76
Daily Pivot Point S1: 129.45
Daily Pivot Point S2: 128.98
Daily Pivot Point S3: 128.55
Daily Pivot Point R1: 130.36
Daily Pivot Point R2: 130.79
Daily Pivot Point R3: 131.26
