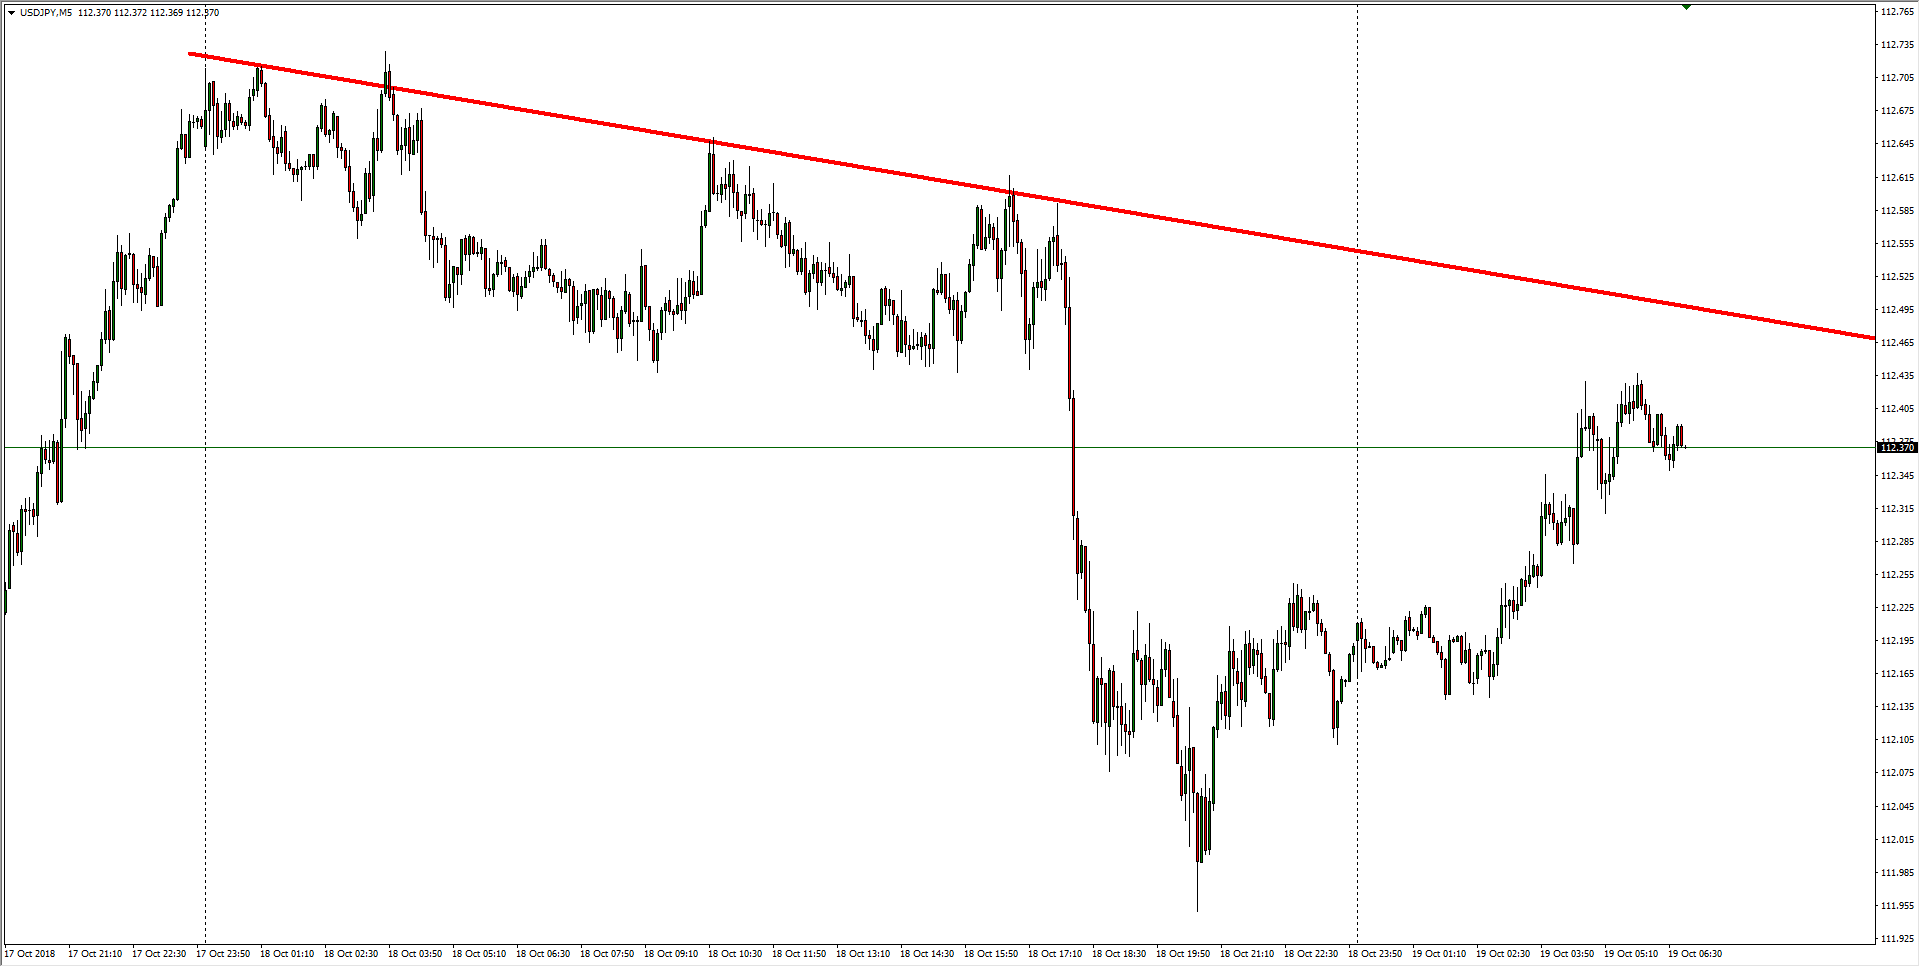
- Over the past twenty-four hours, the USD/JPY dropped from a peak of 112.73 to bottom out at 111.95, and the Dollar-Yen pairing is now trading into 112.40 after Greenback bidders took a bounce to reclaim the 112.00 handle. The pair is now trading just shy of 112.40 and closing in on a descending intraday trendline from yesterday’s consecutive lower peaks.
- USD/JPY Forecast: Bearish outside day has established 112.73 as key resistance
USD/JPY, M5
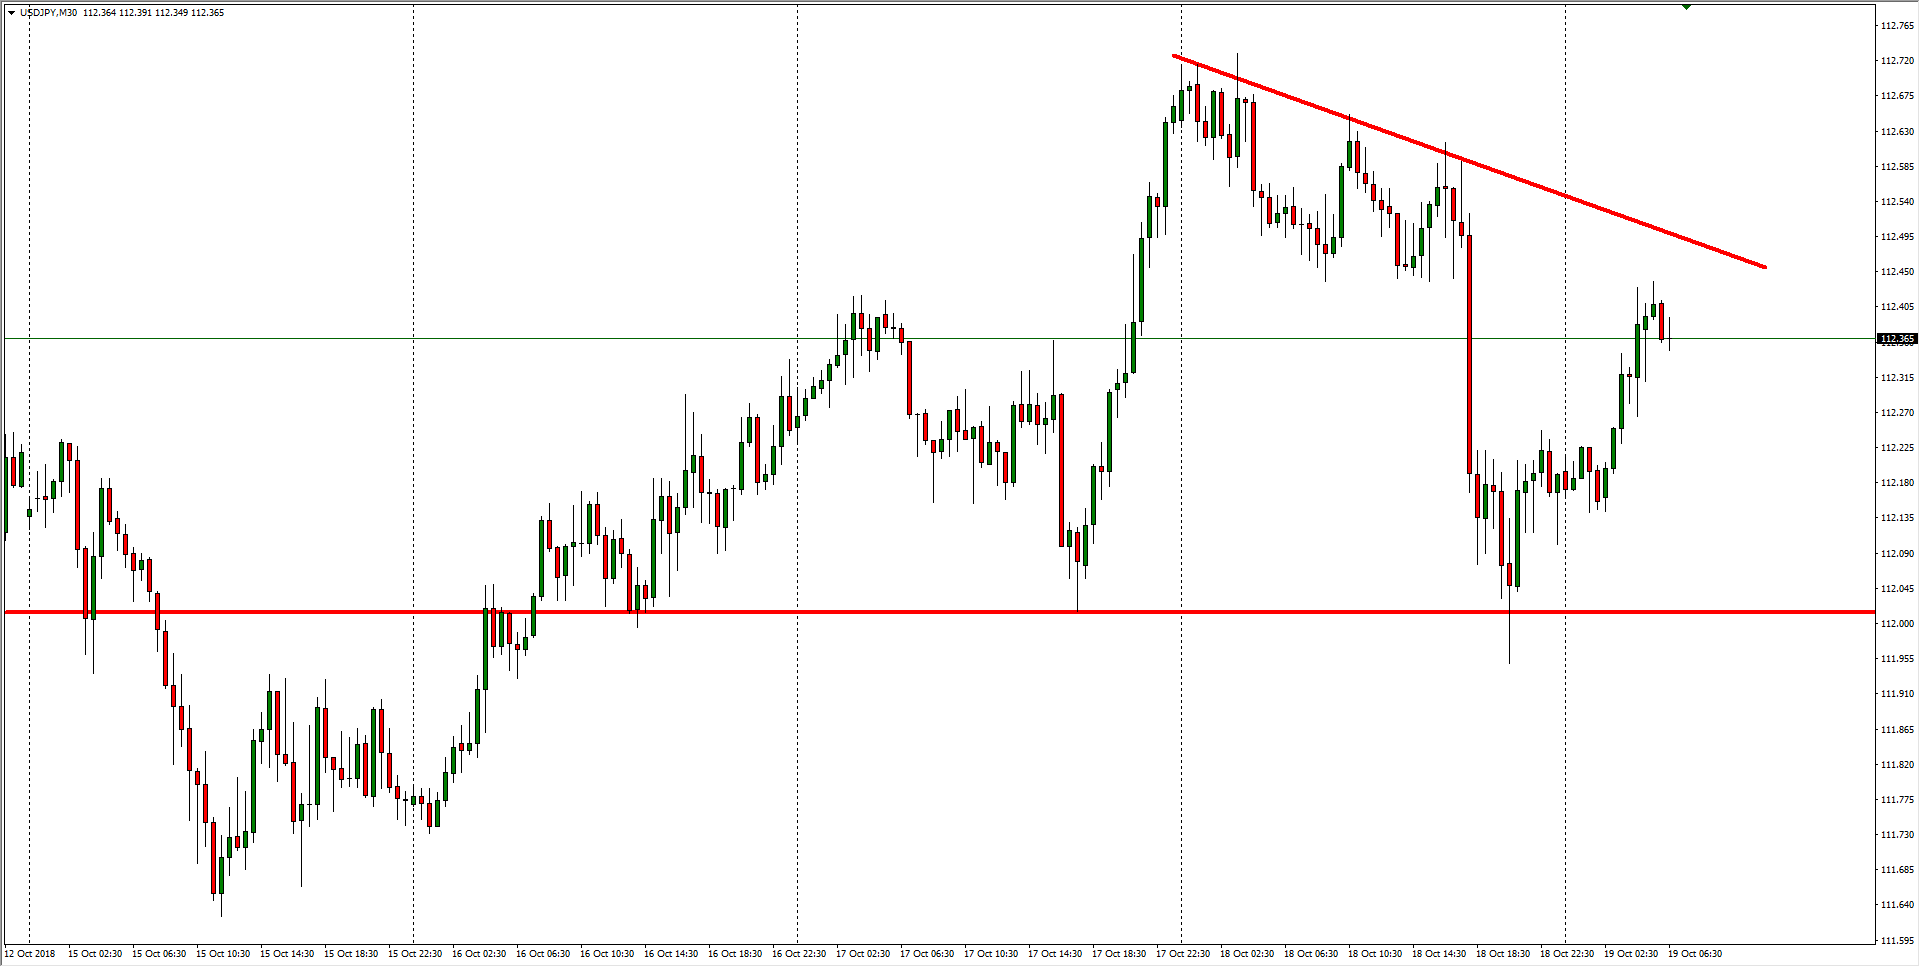
- The past week has seen the USD/JPY strangle between increasing downside pressure and a bolstering effect from the 112.00 critical level, a boundary that buyers have marked in the sand, but buying pressure into the medium-term struggles to develop any real momentum as market sentiment continues to play a major role in USD-based risk flows.
USD/JPY, M30
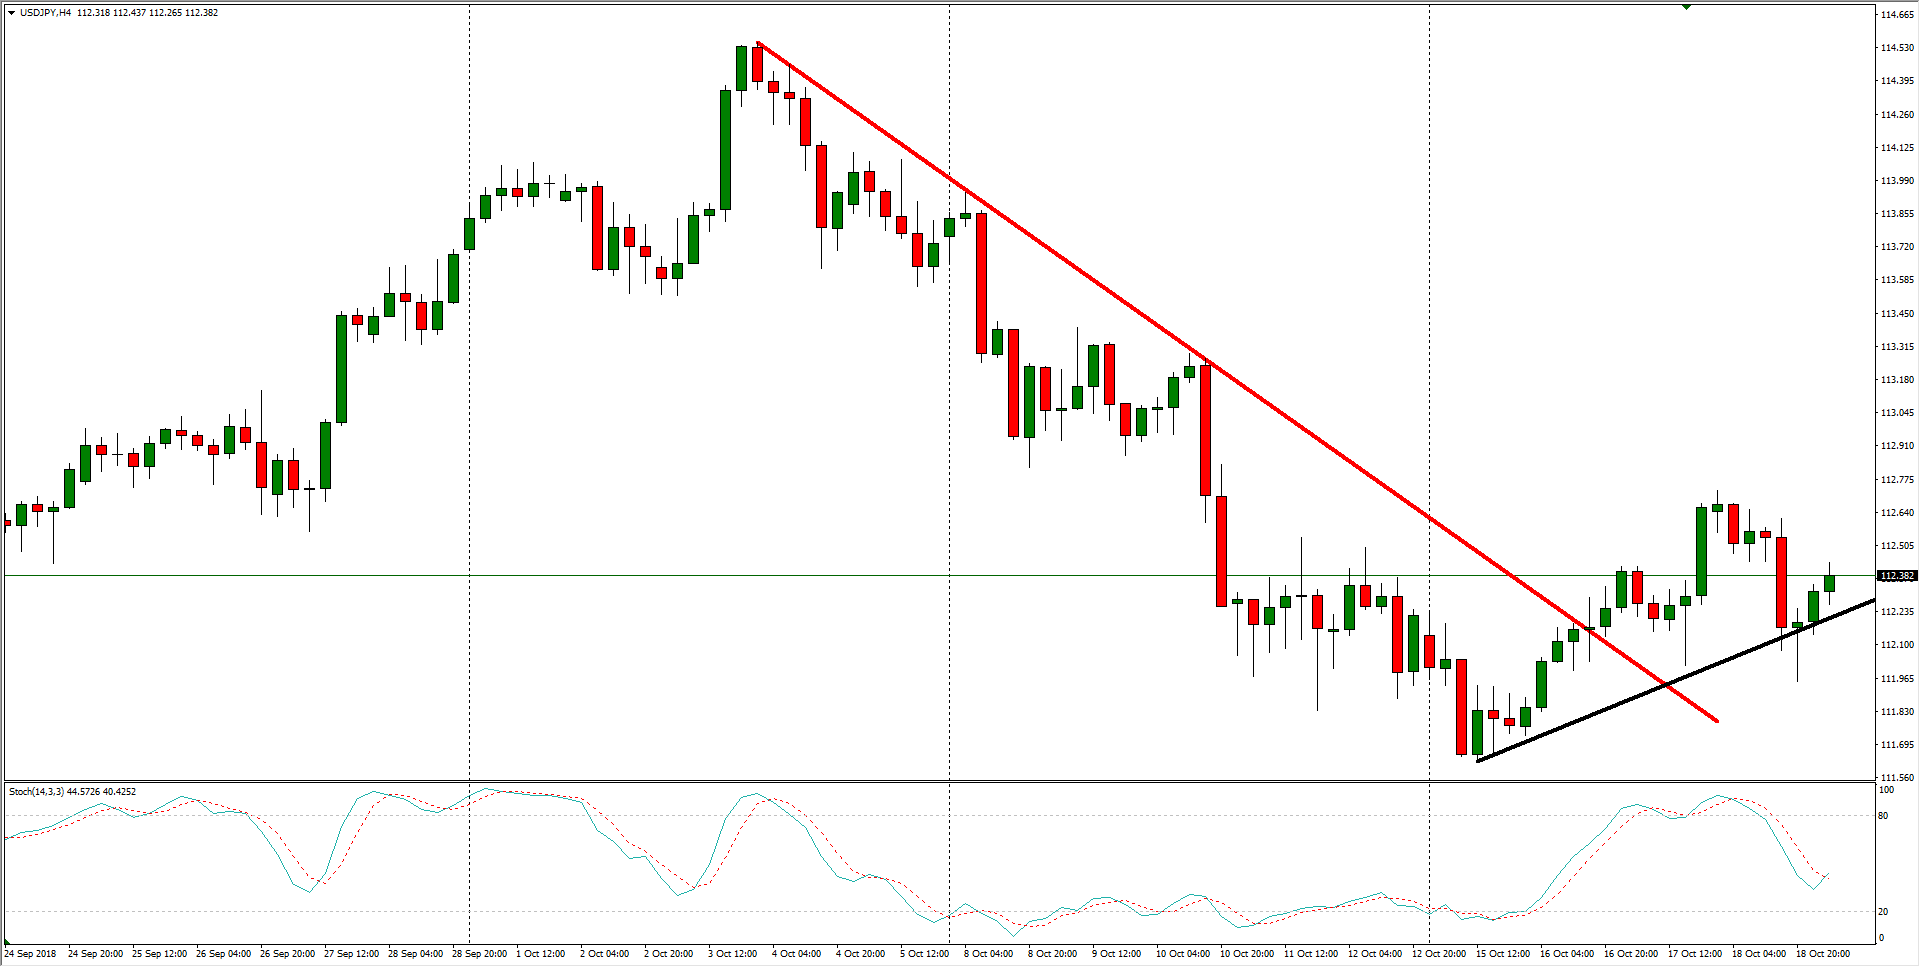
- Over the past month, the USD/JPY looks to have finally broken through a descending trendline from October’s peak of 114.55, and trend-minded Greenback buyers could be looking to coil up for another leg up off of the last higher low, a confluence with the 112.00 major handle, while Slow Stochastics, although not in overbought territory, are beginning to lean back into buy territory just south of the 50 mid-point.
USD/JPY, H4
Don’t forget to check out FXStreet’s Livechart to see what’s happening with the USD/JPY
USD/JPY
Overview:
Last Price: 112.38
Daily change: 17 pips
Daily change: 0.152%
Daily Open: 112.21
Trends:
Daily SMA20: 112.98
Daily SMA50: 111.93
Daily SMA100: 111.42
Daily SMA200: 109.82
Levels:
Daily High: 112.75
Daily Low: 111.95
Weekly High: 113.96
Weekly Low: 111.83
Monthly High: 113.71
Monthly Low: 110.38
Daily Fibonacci 38.2%: 112.26
Daily Fibonacci 61.8%: 112.44
Daily Pivot Point S1: 111.86
Daily Pivot Point S2: 111.51
Daily Pivot Point S3: 111.06
Daily Pivot Point R1: 112.66
Daily Pivot Point R2: 113.1
Daily Pivot Point R3: 113.46
