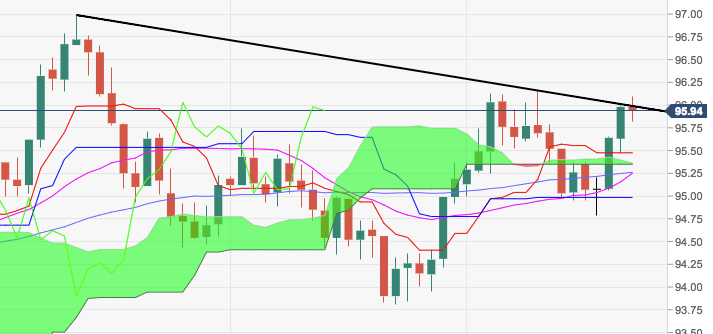
- DXY is gathering further traction at the end of the week and is now trading at either side of the 96.00 milestone, or fresh weekly peaks.
- Immediate target remains the lower 96.00s, where align tops seen earlier in the month. Reinforcing this resistance area lies a Fibo retracement of the 2017-2018 drop at 96.04
- The greenback is also eroding the short-term resistance line, today at 95.99, and a breakout of this area on a convincing fashion is needed to allow for extra gains and a potential visit to YTD highs in the 97.00 neighbourhood.
DXY daily chart
Dollar Index Spot
Overview:
Last Price: 95.95
Daily change: -3.0 pips
Daily change: -0.0313%
Daily Open: 95.98
Trends:
Daily SMA20: 95.22
Daily SMA50: 95.24
Daily SMA100: 94.91
Daily SMA200: 92.83
Levels:
Daily High: 96
Daily Low: 95.48
Weekly High: 96.16
Weekly Low: 94.95
Monthly High: 95.74
Monthly Low: 93.81
Daily Fibonacci 38.2%: 95.8
Daily Fibonacci 61.8%: 95.68
Daily Pivot Point S1: 95.64
Daily Pivot Point S2: 95.3
Daily Pivot Point S3: 95.12
Daily Pivot Point R1: 96.16
Daily Pivot Point R2: 96.34
Daily Pivot Point R3: 96.68
