- Currently, the USD/JPY pair is trading just above the support of the trendline sloping higher from March lows, having printed a nine-day low of 111.82 earlier today.
- A daily close below the trendline support of 112.06 would confirm a bullish-to-bearish trend change and shift risk in favor of a drop to the 200-day EMA of 110.95.
- On the higher side, a move above 112.89 (Oct. 22 high) would imply that the pullback from the recent high of 114.55 has made a temporary low below 112.00 and could yield a move higher toward 114.00.
- The bearish scenario looks likely as the S&P 500 futures have dropped well below the key support of the 50-week EMA, emboldening the bears.
Daily Chart
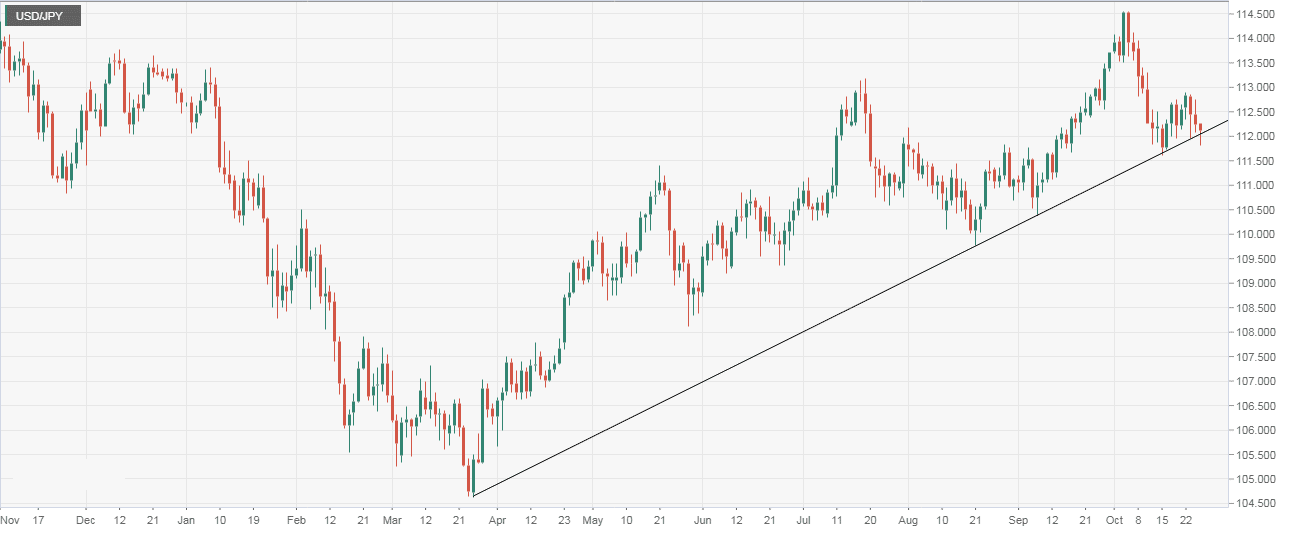
Spot Rate: 112.15
Daily High: 112.24
Daly Low: 111.82
Trend: Bearish below trendline
R1: 112.24 (session high)
R2: 112.42 (10-day EMA)
R3: 112.89 (Oct. 22 high)
Support
S1: 112.06 (trendline support)
S2: 111.82 (session low)
S3: 111.55 (100-day EMA)
