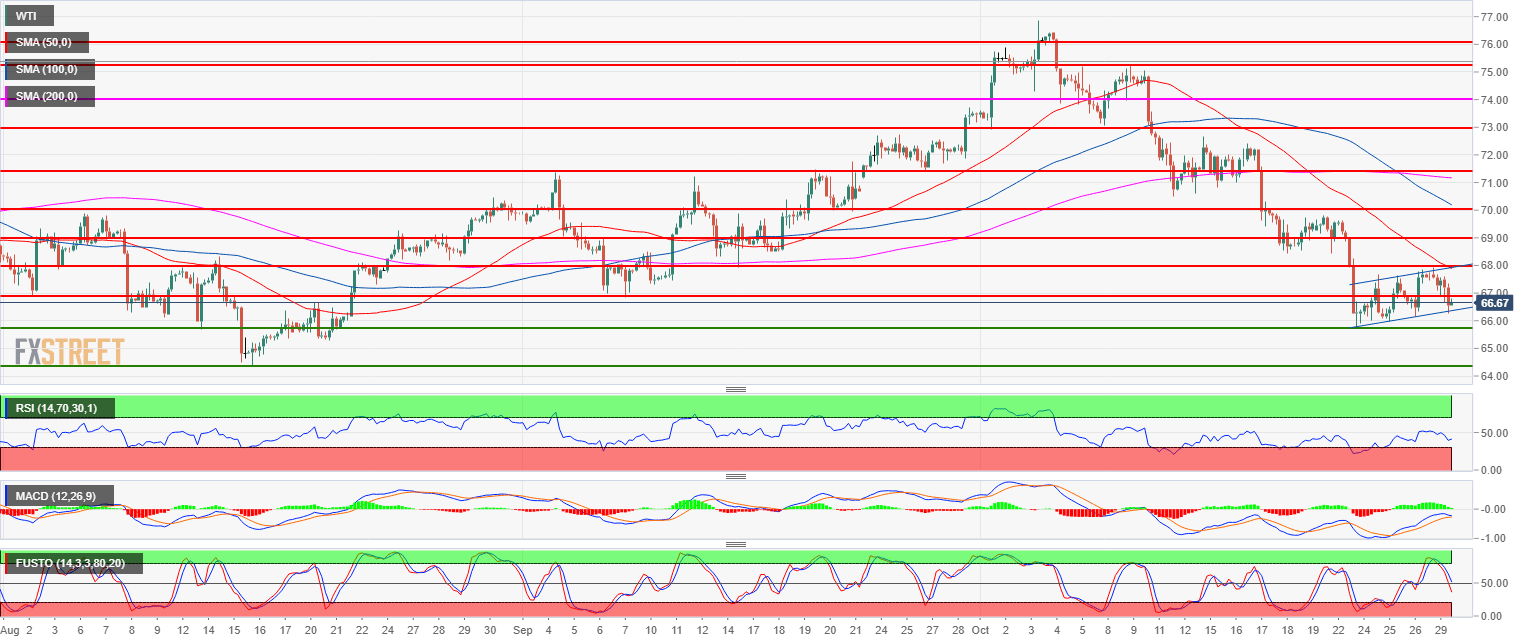
- Crude oil is trading in a bear trend below the 200-period simple moving average on the 4-hour chart.
- Crude oil is consolidating the recent October fall in a bear flag just below the 50-period simple moving average. The RSI indicator is below the 50 line while the MACD is crossing over and the Stochastic is about to drop below the 50 line.
- The path of least resistance is to the downside with bear targets at 65.69 August 13 low and 64.40 August low.
Crude oil WTI 4-hour chart
Main Trend: Bearish
Resistance 1: 67.92 September 14 low
Resistance 2: 69.00 figure
Resistance 3: 70.00 figure
Resistance 4: 70.53 May 24 low
Resistance 5: 71.45 September 26 low
Support 1: 66.84 September low
Support 2: 65.69 August 13 low
Support 3: 64.40 August low
WTI
Overview:
Last Price: 66.67
Daily change: -99 pips
Daily change: -1.46%
Daily Open: 67.66
Trends:
Daily SMA20: 70.5
Daily SMA50: 70.68
Daily SMA100: 69.78
Daily SMA200: 68.43
Levels:
Daily High: 67.73
Daily Low: 67.45
Weekly High: 69.65
Weekly Low: 66.08
Monthly High: 73.7
Monthly Low: 66.84
Daily Fibonacci 38.2%: 67.62
Daily Fibonacci 61.8%: 67.56
Daily Pivot Point S1: 67.5
Daily Pivot Point S2: 67.33
Daily Pivot Point S3: 67.22
Daily Pivot Point R1: 67.78
Daily Pivot Point R2: 67.89
Daily Pivot Point R3: 68.06
