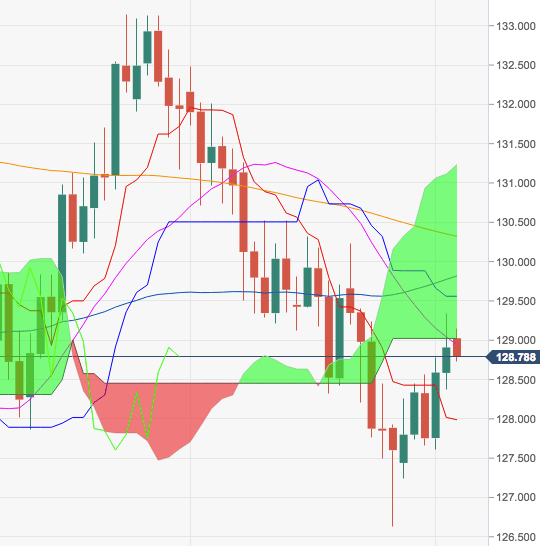
- After two consecutive daily advances, EUR/JPY faced an important hurdle in the vicinity of 129.50 on Friday, where aligns the 100-day SMA.
- The continuation of the correction lower should meet interim support in the 10-day SMA at 128.25 ahead of October’s low at 126.61 (October 26).
- On the other hand, occasional bullish attempts should meet the next hurdle near 129.50, coincident with last week’s peak and the 100-day SMA.
EUR/JPY daily chart
EUR/JPY
Overview:
Last Price: 128.77
Daily change: -14 pips
Daily change: -0.109%
Daily Open: 128.91
Trends:
Daily SMA20: 128.95
Daily SMA50: 129.95
Daily SMA100: 129.45
Daily SMA200: 130.38
Levels:
Daily High: 129.34
Daily Low: 128.37
Weekly High: 129.34
Weekly Low: 127.24
Monthly High: 132.49
Monthly Low: 126.63
Daily Fibonacci 38.2%: 128.97
Daily Fibonacci 61.8%: 128.74
Daily Pivot Point S1: 128.4
Daily Pivot Point S2: 127.9
Daily Pivot Point S3: 127.43
Daily Pivot Point R1: 129.38
Daily Pivot Point R2: 129.85
Daily Pivot Point R3: 130.35
