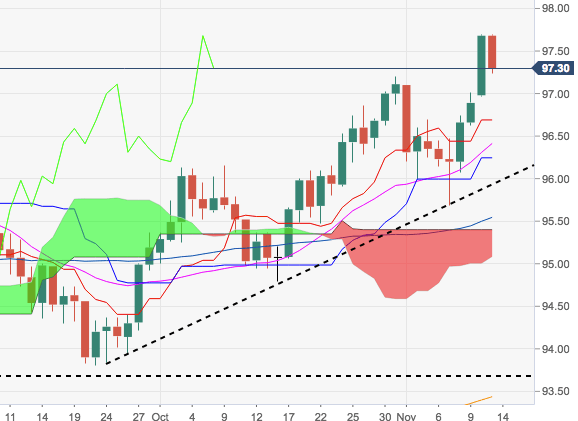
- The index is reverting the recent multi-day positive streak and is retreating to the 97.30 region after clinching fresh 2018 highs near 97.70 on Monday and earlier today.
- The rally in the buck carries the potential to advance to the 97.87 level, where converge June 2017 peaks and a Fibo retracement of the 2017-2018 drop.
- As long as the short-term support line at 95.93 underpins, the likeliness of extra gains in DXY remains well on the cards in the near term.
DXY daily chart
Dollar Index Spot
Overview:
Last Price: 97.29
Daily change: -39 pips
Daily change: -0.399%
Daily Open: 97.68
Trends:
Daily SMA20: 96.37
Daily SMA50: 95.56
Daily SMA100: 95.3
Daily SMA200: 93.4
Levels:
Daily High: 97.7
Daily Low: 96.97
Weekly High: 97.01
Weekly Low: 95.68
Monthly High: 97.2
Monthly Low: 94.79
Daily Fibonacci 38.2%: 97.42
Daily Fibonacci 61.8%: 97.25
Daily Pivot Point S1: 97.2
Daily Pivot Point S2: 96.72
Daily Pivot Point S3: 96.47
Daily Pivot Point R1: 97.93
Daily Pivot Point R2: 98.18
Daily Pivot Point R3: 98.66
