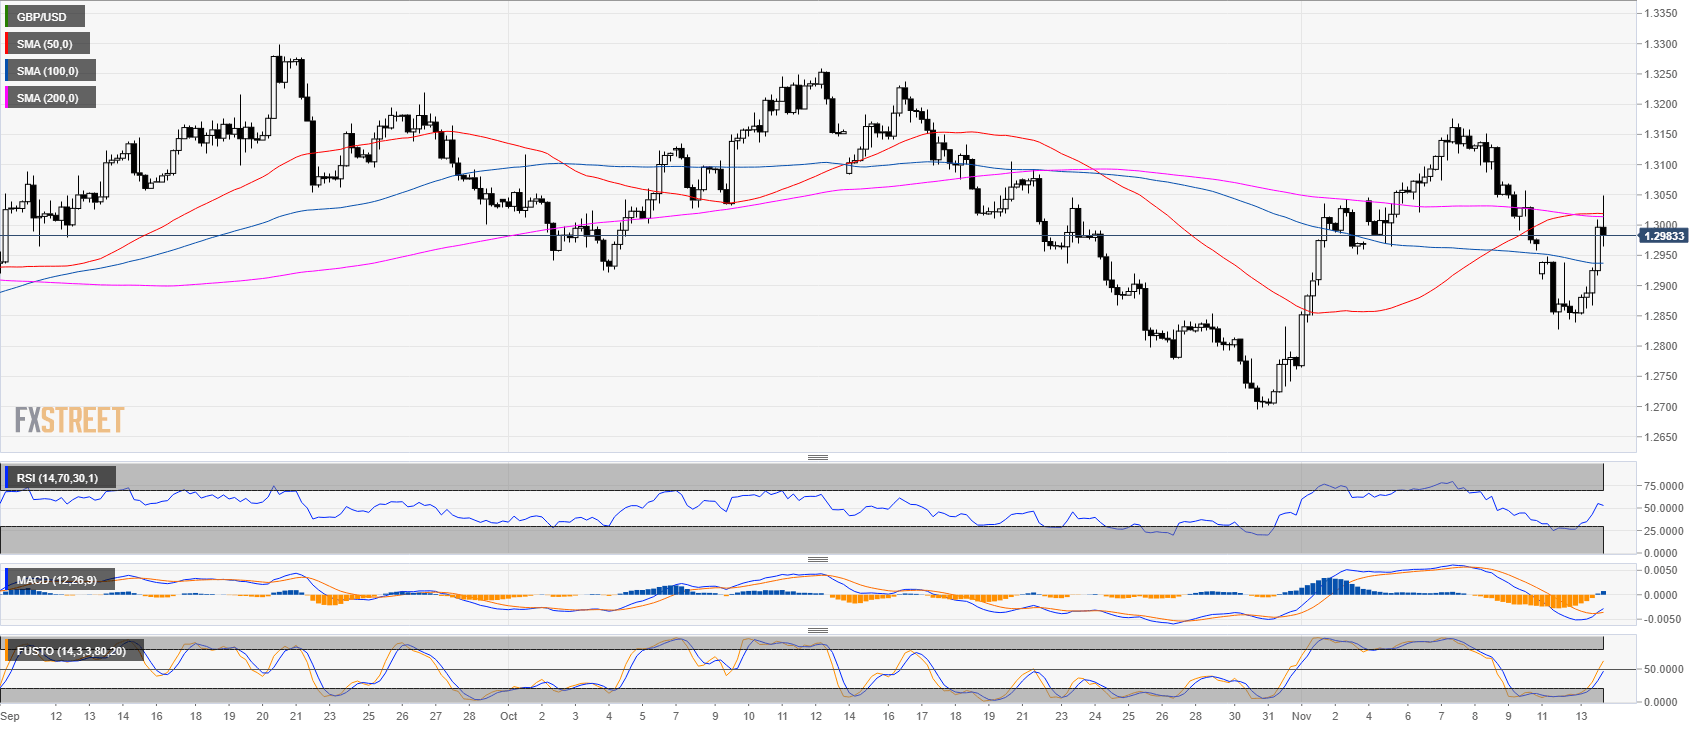
GBP/USD daily chart
-636777290591116222.png)
- GBP/USD buills are facing a very strong resistance level made of 1.3000 figure and the 50 and 100-day simple moving average.
- Interestingly the 50 SMA is crossing above the 100 SMA, which is called a golden cross and potentially bullish in the coming weeks.
GBP/USD 4-hour chart
- Bulls went as high as 1.3050 but found no buying interest up there.
GBP/USD 30-minute chart
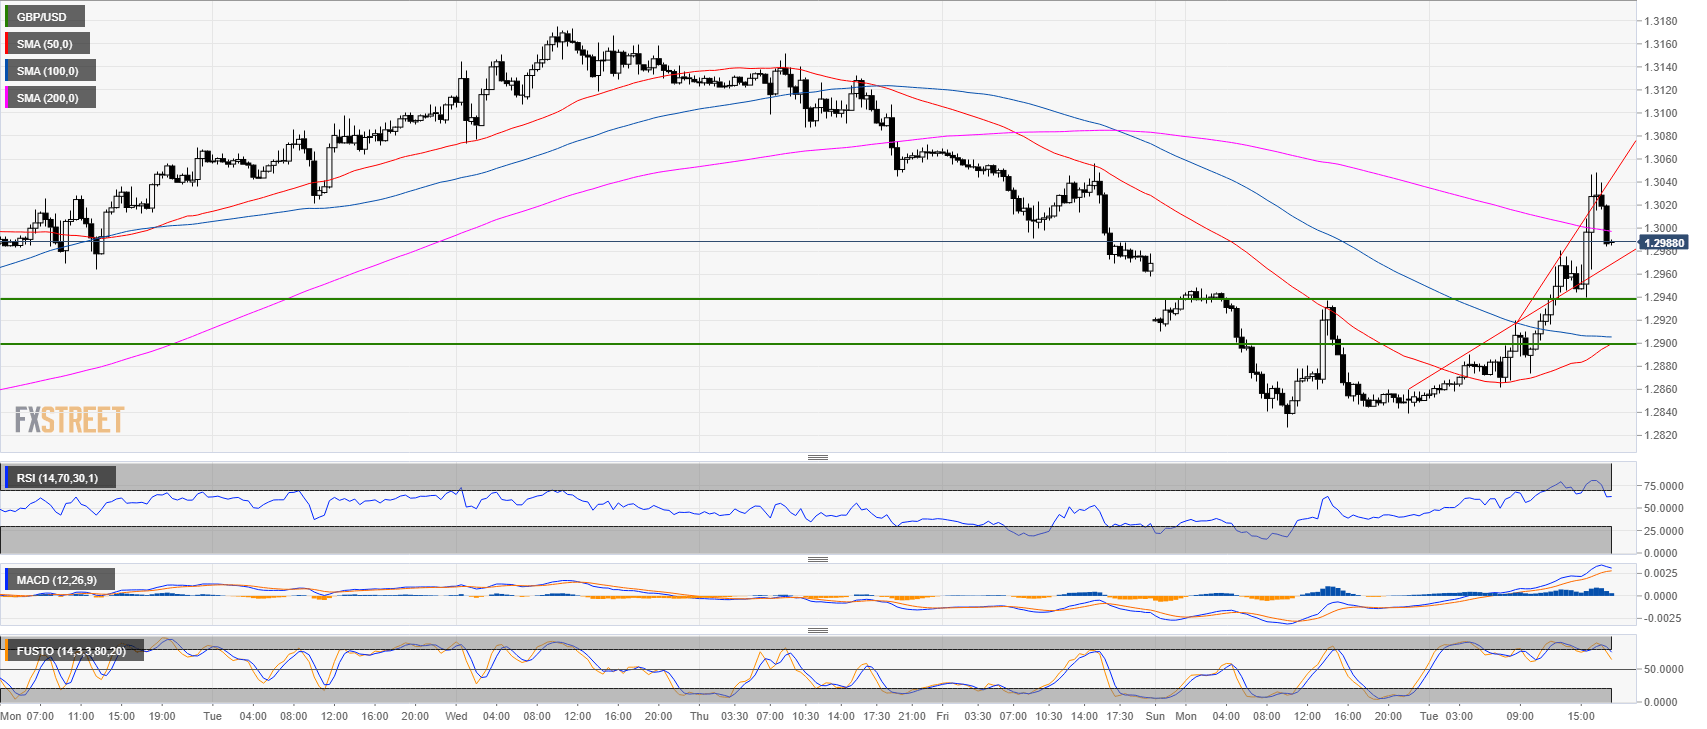
- The climactic move up should lead to a correction down to 1.2940 and 1.2900 figure
Additional key levels at a glance:
GBP/USD
Overview:
Last Price: 1.2986
Daily change: 1.3e+2 pips
Daily change: 1.03%
Daily Open: 1.2853
Trends:
Daily SMA20: 1.2963
Daily SMA50: 1.3032
Daily SMA100: 1.303
Daily SMA200: 1.3396
Levels:
Daily High: 1.2948
Daily Low: 1.2827
Weekly High: 1.3176
Weekly Low: 1.2958
Monthly High: 1.326
Monthly Low: 1.2696
Daily Fibonacci 38.2%: 1.2874
Daily Fibonacci 61.8%: 1.2902
Daily Pivot Point S1: 1.2804
Daily Pivot Point S2: 1.2755
Daily Pivot Point S3: 1.2683
Daily Pivot Point R1: 1.2925
Daily Pivot Point R2: 1.2997
Daily Pivot Point R3: 1.3046
