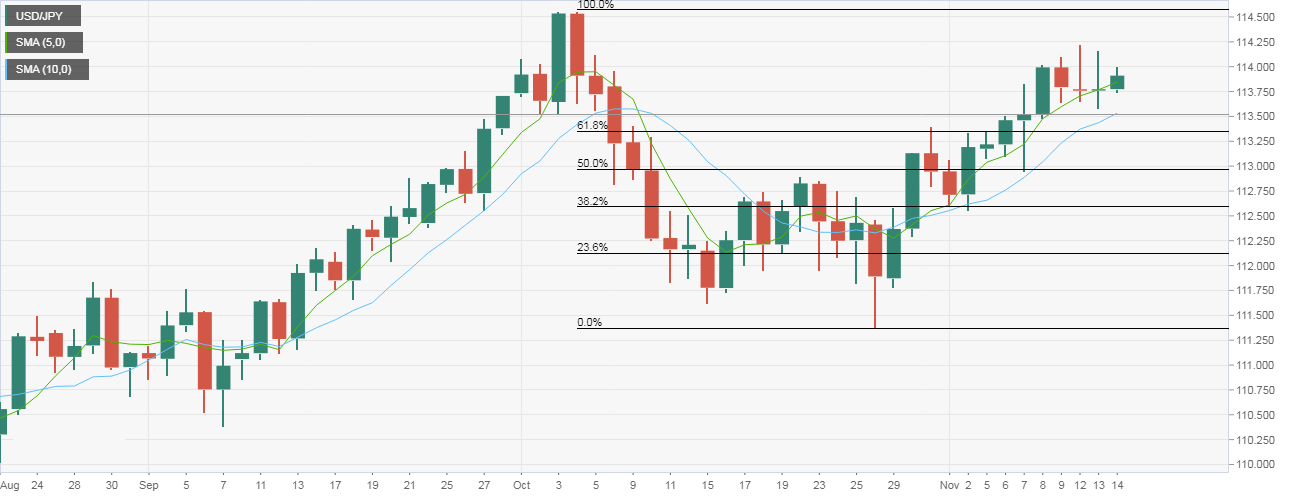
- The USD/JPY pair created doji candle on Monday and Tuesday, signaling indecision in the marketplace.
- A break above 114.23 (high of the Monday’s doji) would signal a resumption of the rally from the Oct. 26 low of 111.38 and would open up upside toward the recent high of 114.55.
- The 5-day and 10-day simple moving averages (SMAs) are trending north indicating a bullish setup. Further, the pair has found acceptance above 113.34 – 61.8% Fib R of 114.55/111.38. As a result, the pair is likely to cross 114.23 in favor of the bulls.
- A close below 113.58 (low of yesterday’s doji) would confirm a short-term bearish doji reversal, although prospects of a deeper drop would remain low as long as the pair is holding above the 10-day SMA.
Daily Chart
Trend: Neutral-to-bullish
USD/JPY
Overview:
Last Price: 113.94
Daily change: 17 pips
Daily change: 0.149%
Daily Open: 113.77
Trends:
Daily SMA20: 112.96
Daily SMA50: 112.68
Daily SMA100: 111.95
Daily SMA200: 110.08
Levels:
Daily High: 114.16
Daily Low: 113.58
Weekly High: 114.1
Weekly Low: 112.94
Monthly High: 114.56
Monthly Low: 111.38
Daily Fibonacci 38.2%: 113.94
Daily Fibonacci 61.8%: 113.8
Daily Pivot Point S1: 113.52
Daily Pivot Point S2: 113.26
Daily Pivot Point S3: 112.94
Daily Pivot Point R1: 114.1
Daily Pivot Point R2: 114.42
Daily Pivot Point R3: 114.68
