USD/JPY daily chart
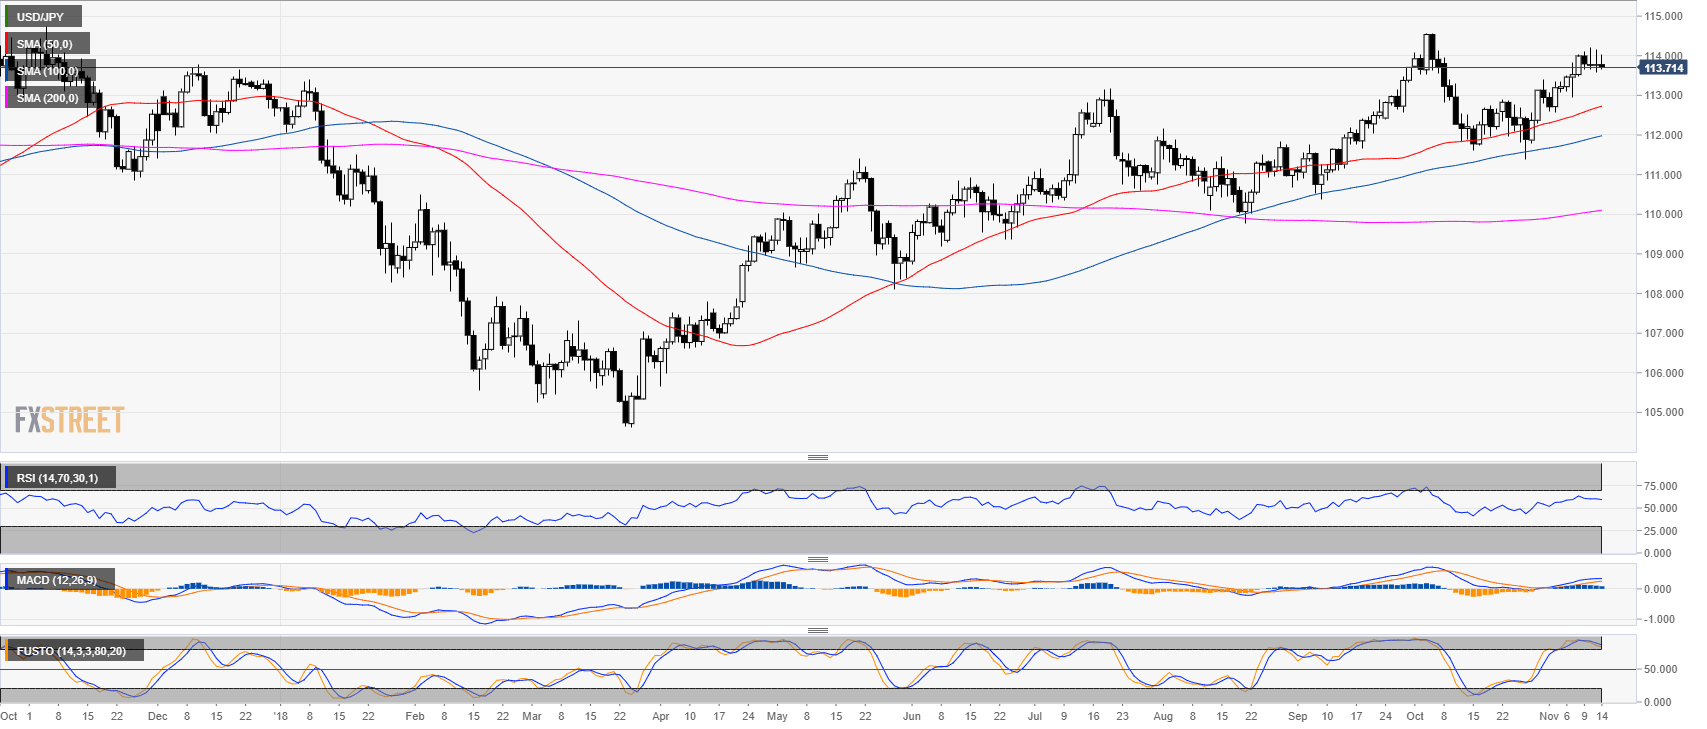
- USD/JPY is consolidating below the 114.00 figure for the fifth day in a row.
- The Stochastic indicator is in overbought condition.
USD/JPY 4-hour chart
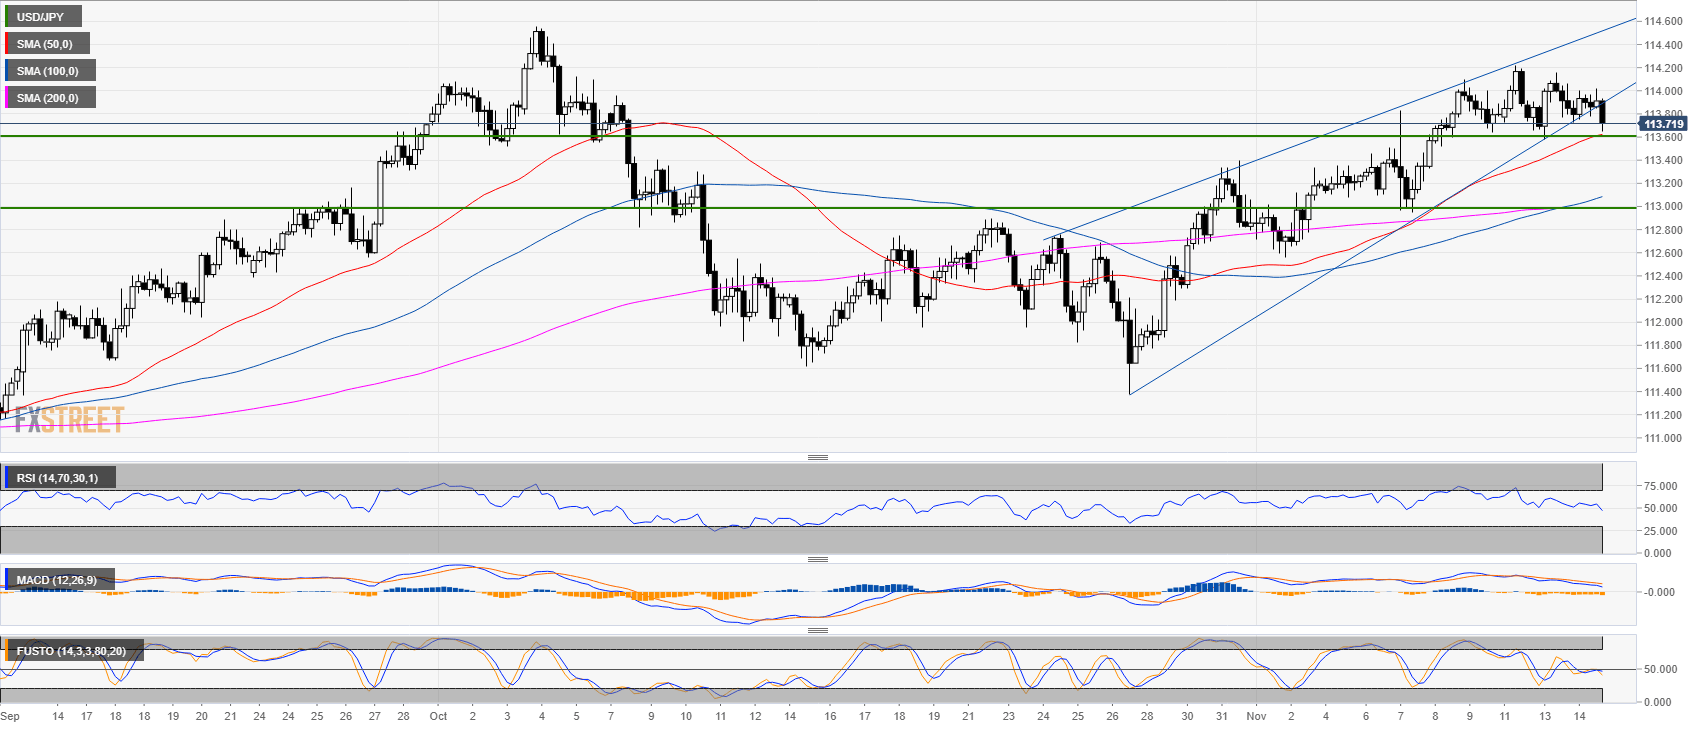
- USD/JPY is trading in a bull trend above the 200-period simple moving average (SMA).
- USD/JPY has formed a potentially bearish wedge.
- Technical indicators are losing steam.
USD/JPY 30-minute chart
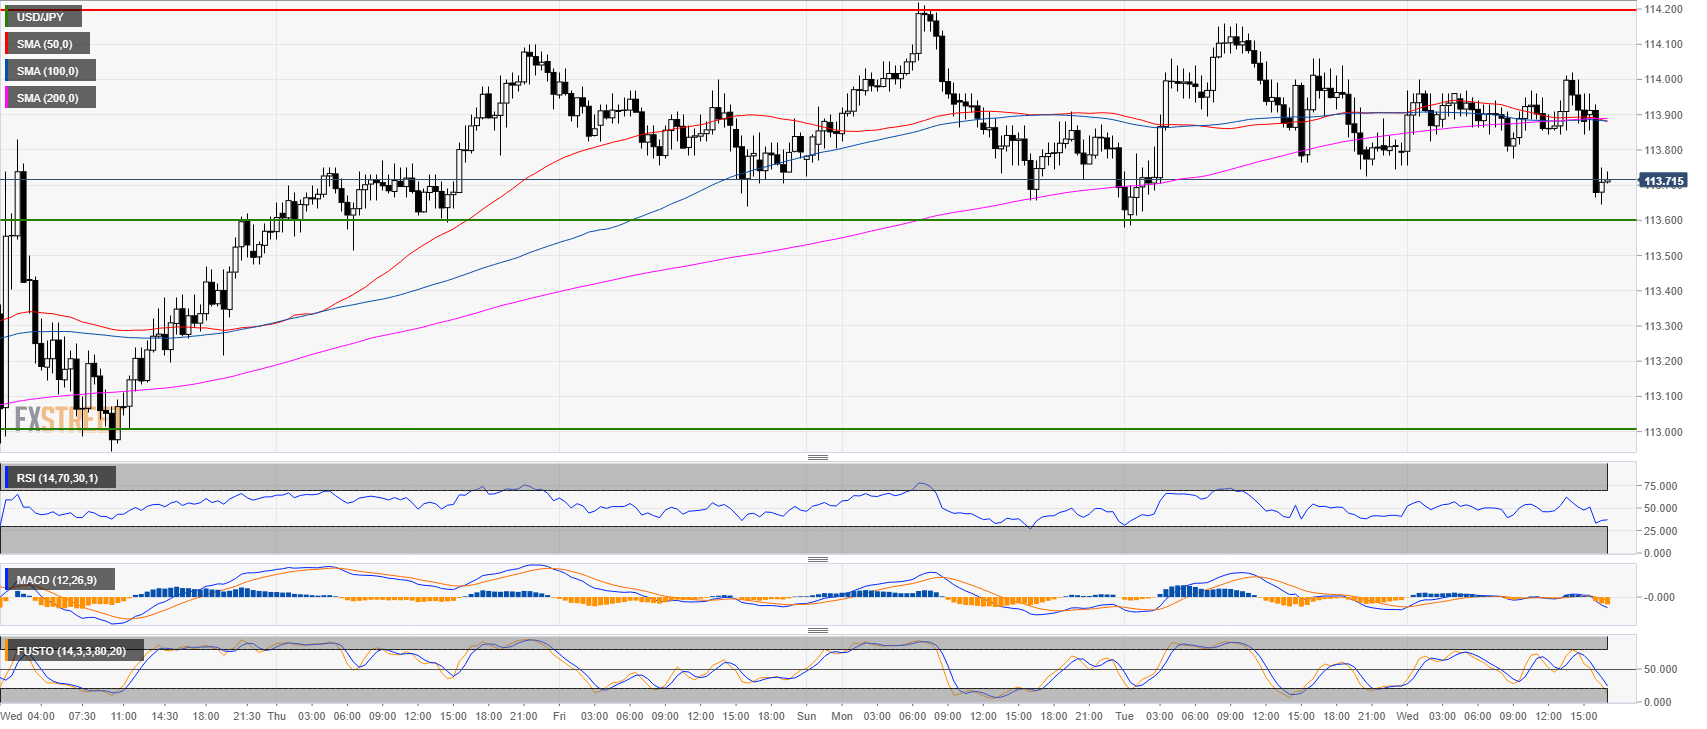
- If bears break below 113.60 support it can open the door to 113.00 figure.
- The move down coincides with a move down on US indices and a US yields decelerating with the 10-year note at 3.12%.
Additional key levels at a glance:
USD/JPY
Overview:
Last Price: 113.72
Daily change: -5.0 pips
Daily change: -0.0439%
Daily Open: 113.77
Trends:
Daily SMA20: 112.96
Daily SMA50: 112.68
Daily SMA100: 111.95
Daily SMA200: 110.08
Levels:
Daily High: 114.16
Daily Low: 113.58
Weekly High: 114.1
Weekly Low: 112.94
Monthly High: 114.56
Monthly Low: 111.38
Daily Fibonacci 38.2%: 113.94
Daily Fibonacci 61.8%: 113.8
Daily Pivot Point S1: 113.52
Daily Pivot Point S2: 113.26
Daily Pivot Point S3: 112.94
Daily Pivot Point R1: 114.1
Daily Pivot Point R2: 114.42
Daily Pivot Point R3: 114.68
