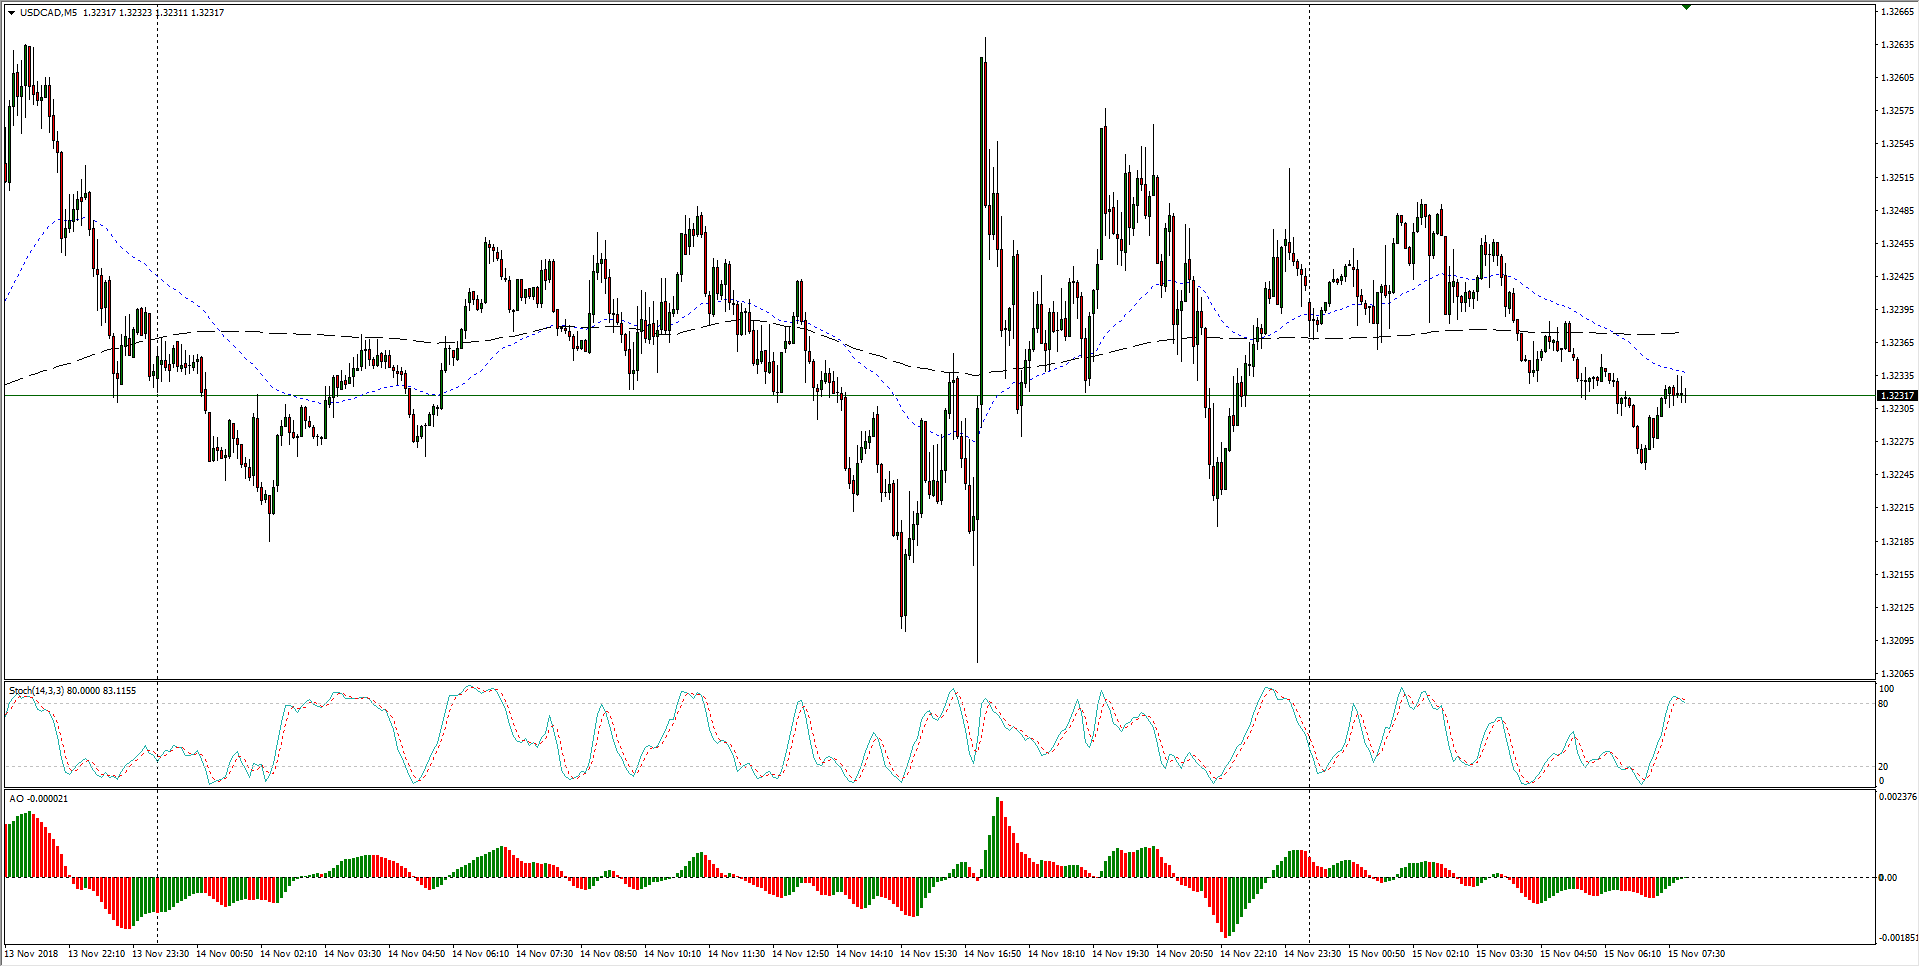
- The intraday chart has gone fully sideway, and the USD/CAD remains largely unchanged from where it was over twenty-four hours ago.
- With the USD/CAD entangled in near-term consolidation, traders should wait for a break-and-retest of key levels before picking a direction.
USD/CAD Chart, 5-Minute
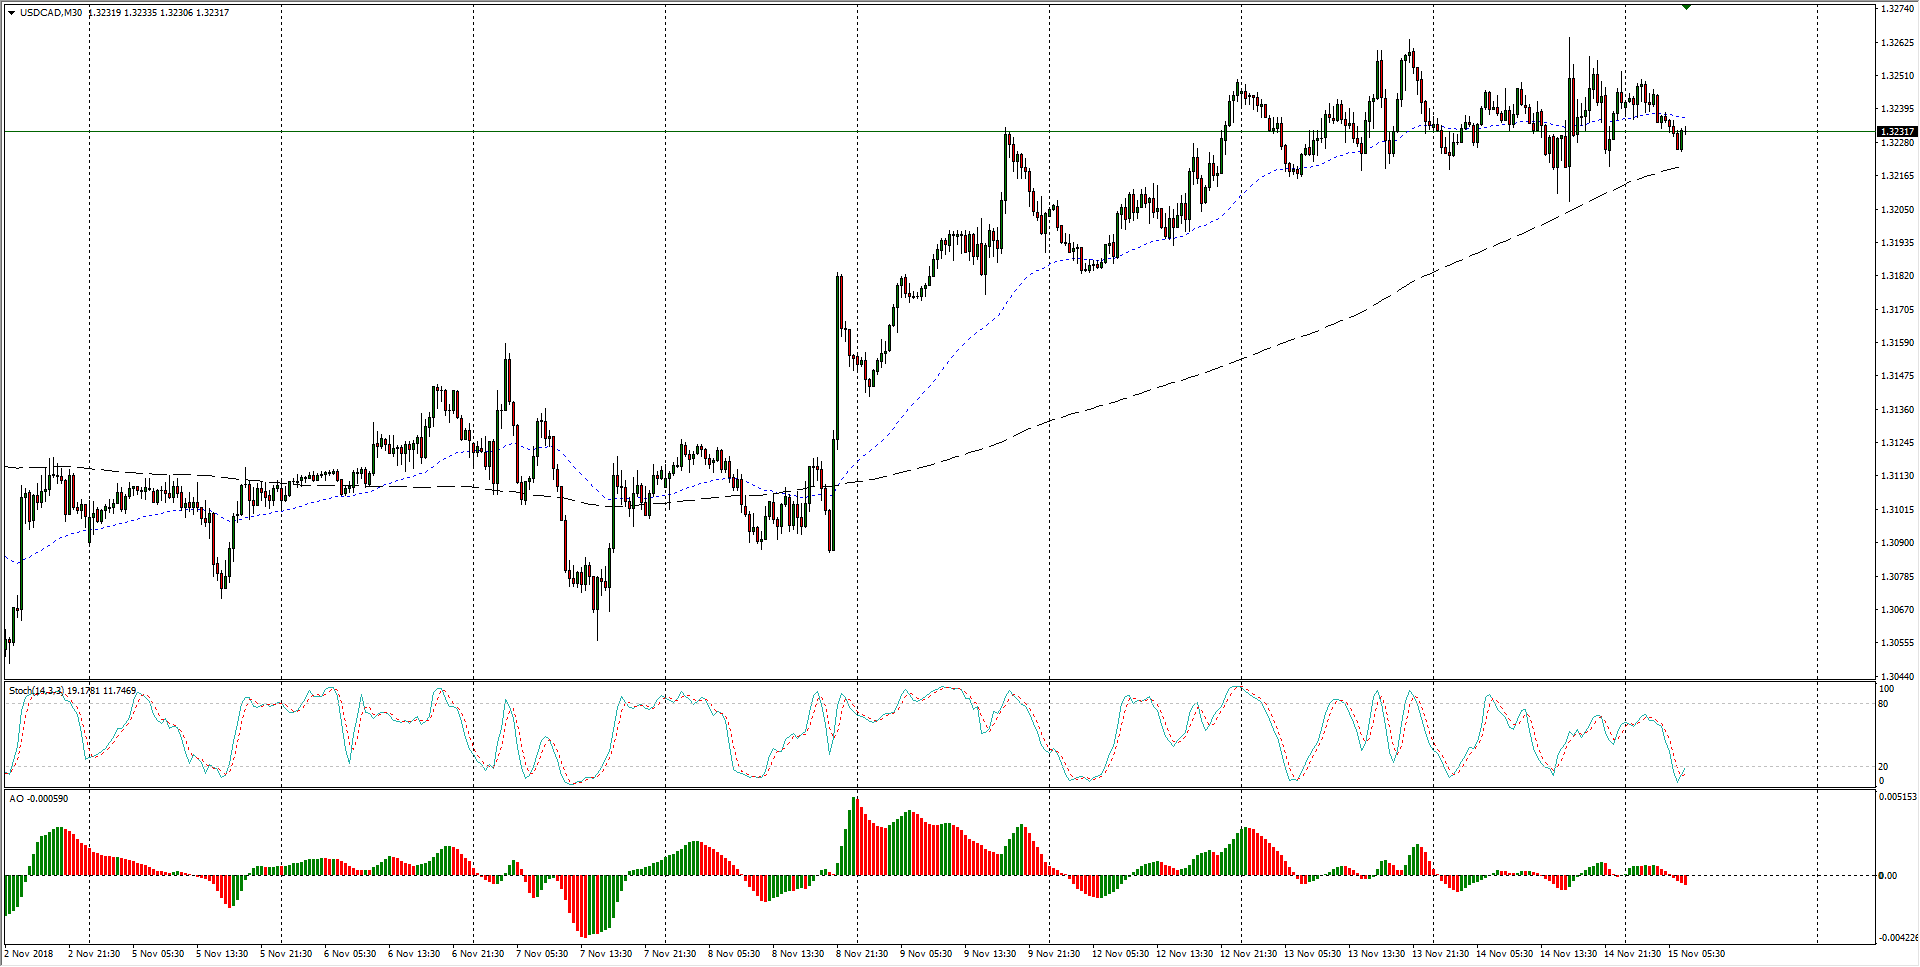
- A near-term consolidation phase is the key defining characteristic of the USD/CAD, and a kick into new highs recently has seen momentum fully stall out.
USD/CAD Chart, 30-Minute
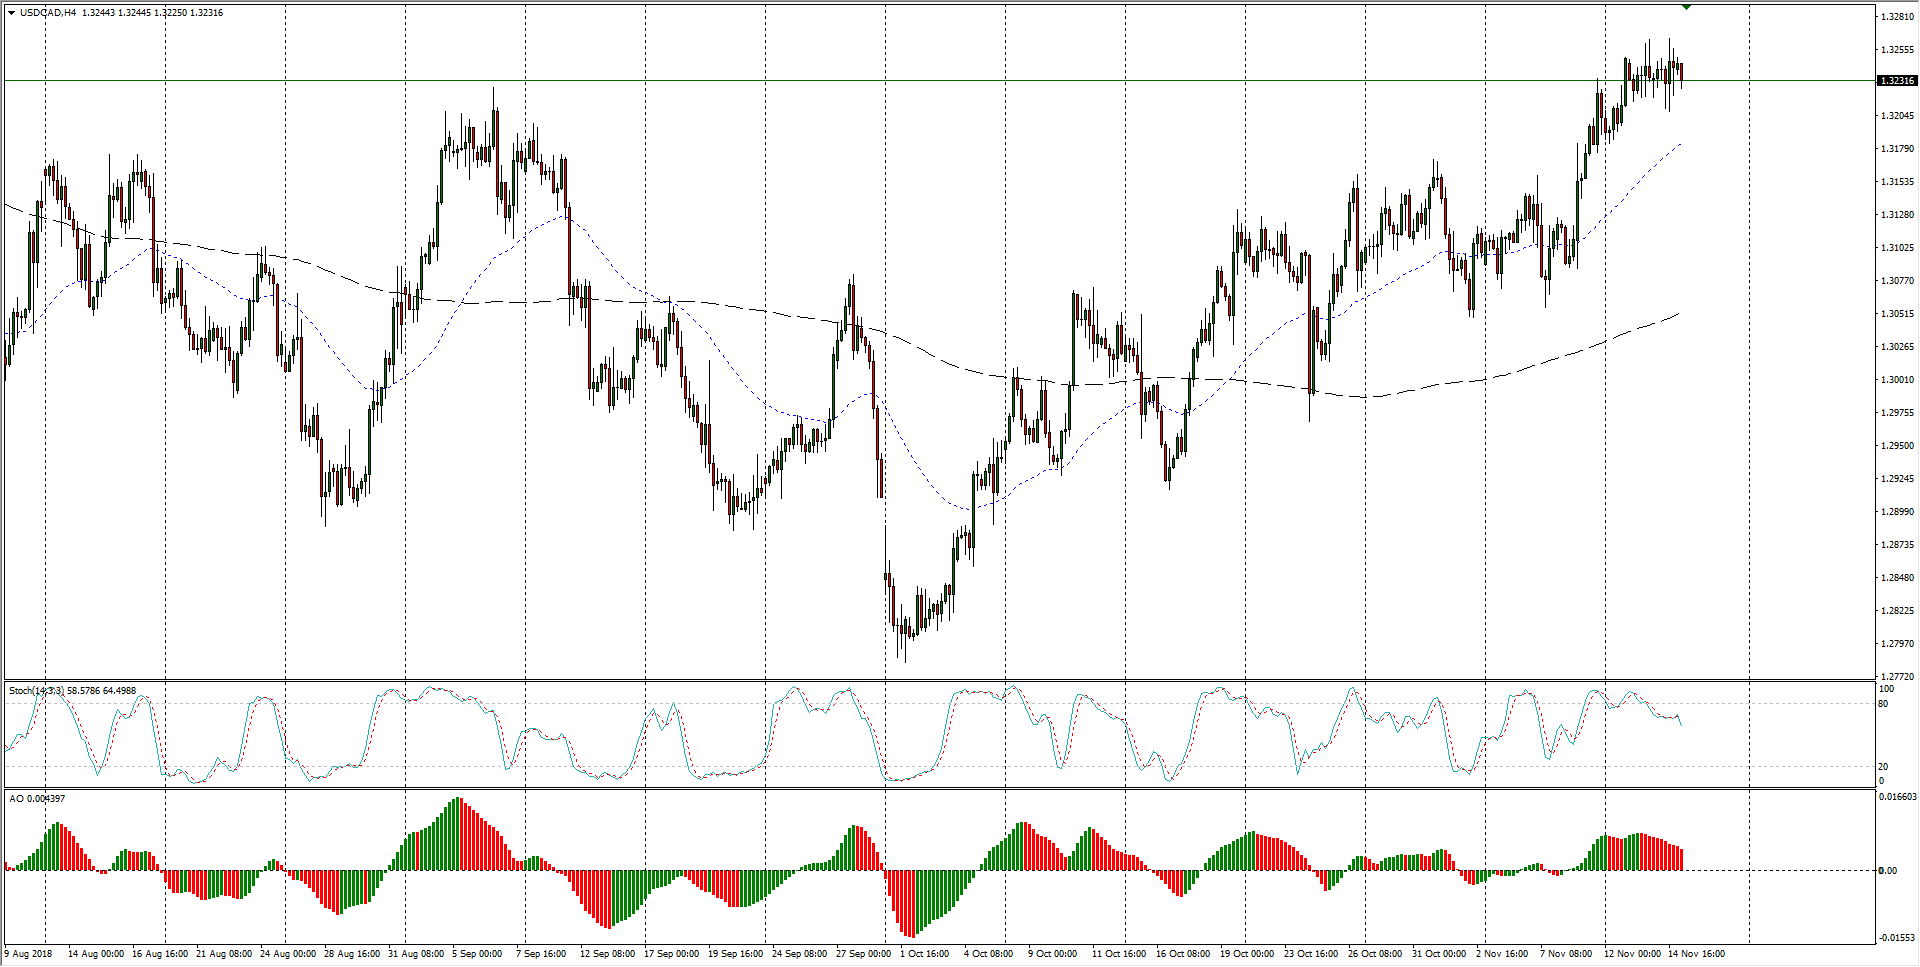
- The past two months has seen the USD/CAD battle brief bouts of consolidation, and directional bias is being set in short frenetic bursts of price action. Higher lows across key charts leaves the USD/CAD leaning into the bullish side, but stops will have to be set wide to accommodate volume-constrained rushes in both directions.
USD/CAD Chart, 4-Hour
USD/CAD
Overview:
Last Price: 1.3232
Daily change: -6.0 pips
Daily change: -0.0453%
Daily Open: 1.3238
Trends:
Daily SMA20: 1.3132
Daily SMA50: 1.3045
Daily SMA100: 1.307
Daily SMA200: 1.296
Levels:
Daily High: 1.3264
Daily Low: 1.3208
Weekly High: 1.3233
Weekly Low: 1.3056
Monthly High: 1.3172
Monthly Low: 1.2783
Daily Fibonacci 38.2%: 1.3229
Daily Fibonacci 61.8%: 1.3243
Daily Pivot Point S1: 1.3209
Daily Pivot Point S2: 1.318
Daily Pivot Point S3: 1.3152
Daily Pivot Point R1: 1.3266
Daily Pivot Point R2: 1.3294
Daily Pivot Point R3: 1.3323
