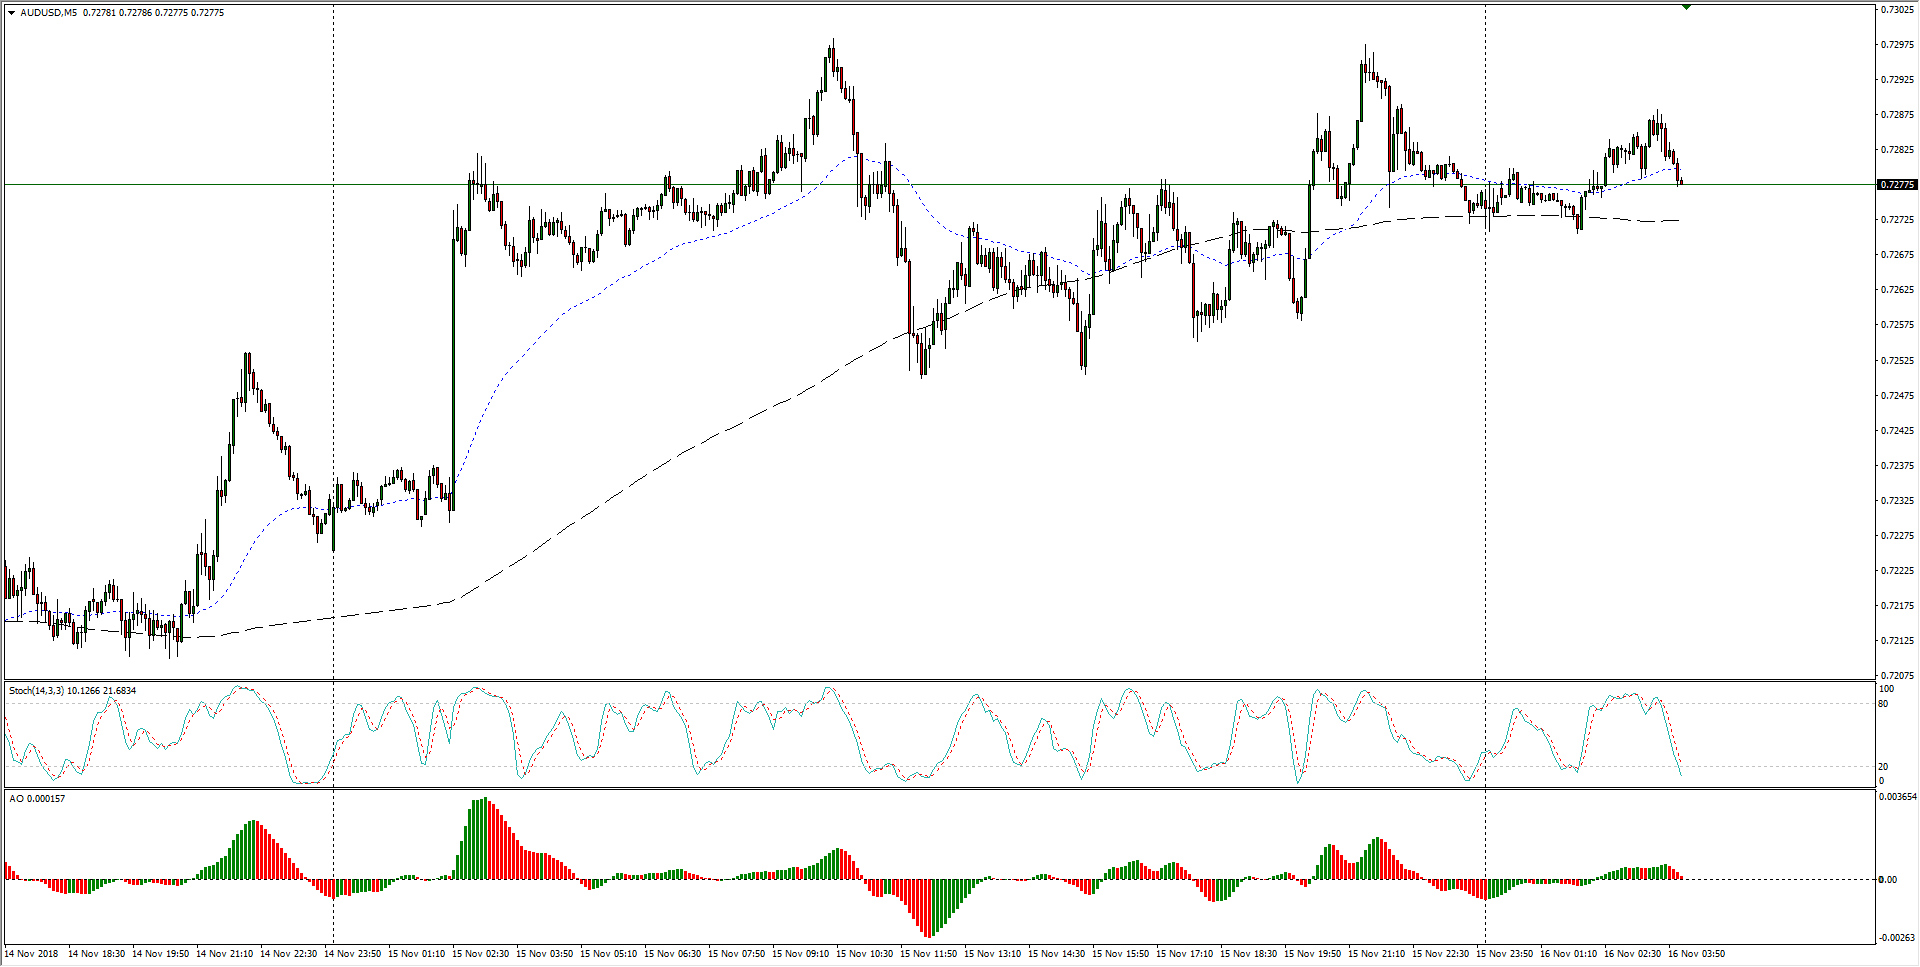
- The short-term Aussie chart has left the AUD/USD in the lurch, strung out in a constraining pattern within Thursday’s trading range as the broader markets await further impetus to trigger directional changes.
AUD/USD Chart, 5-Minute
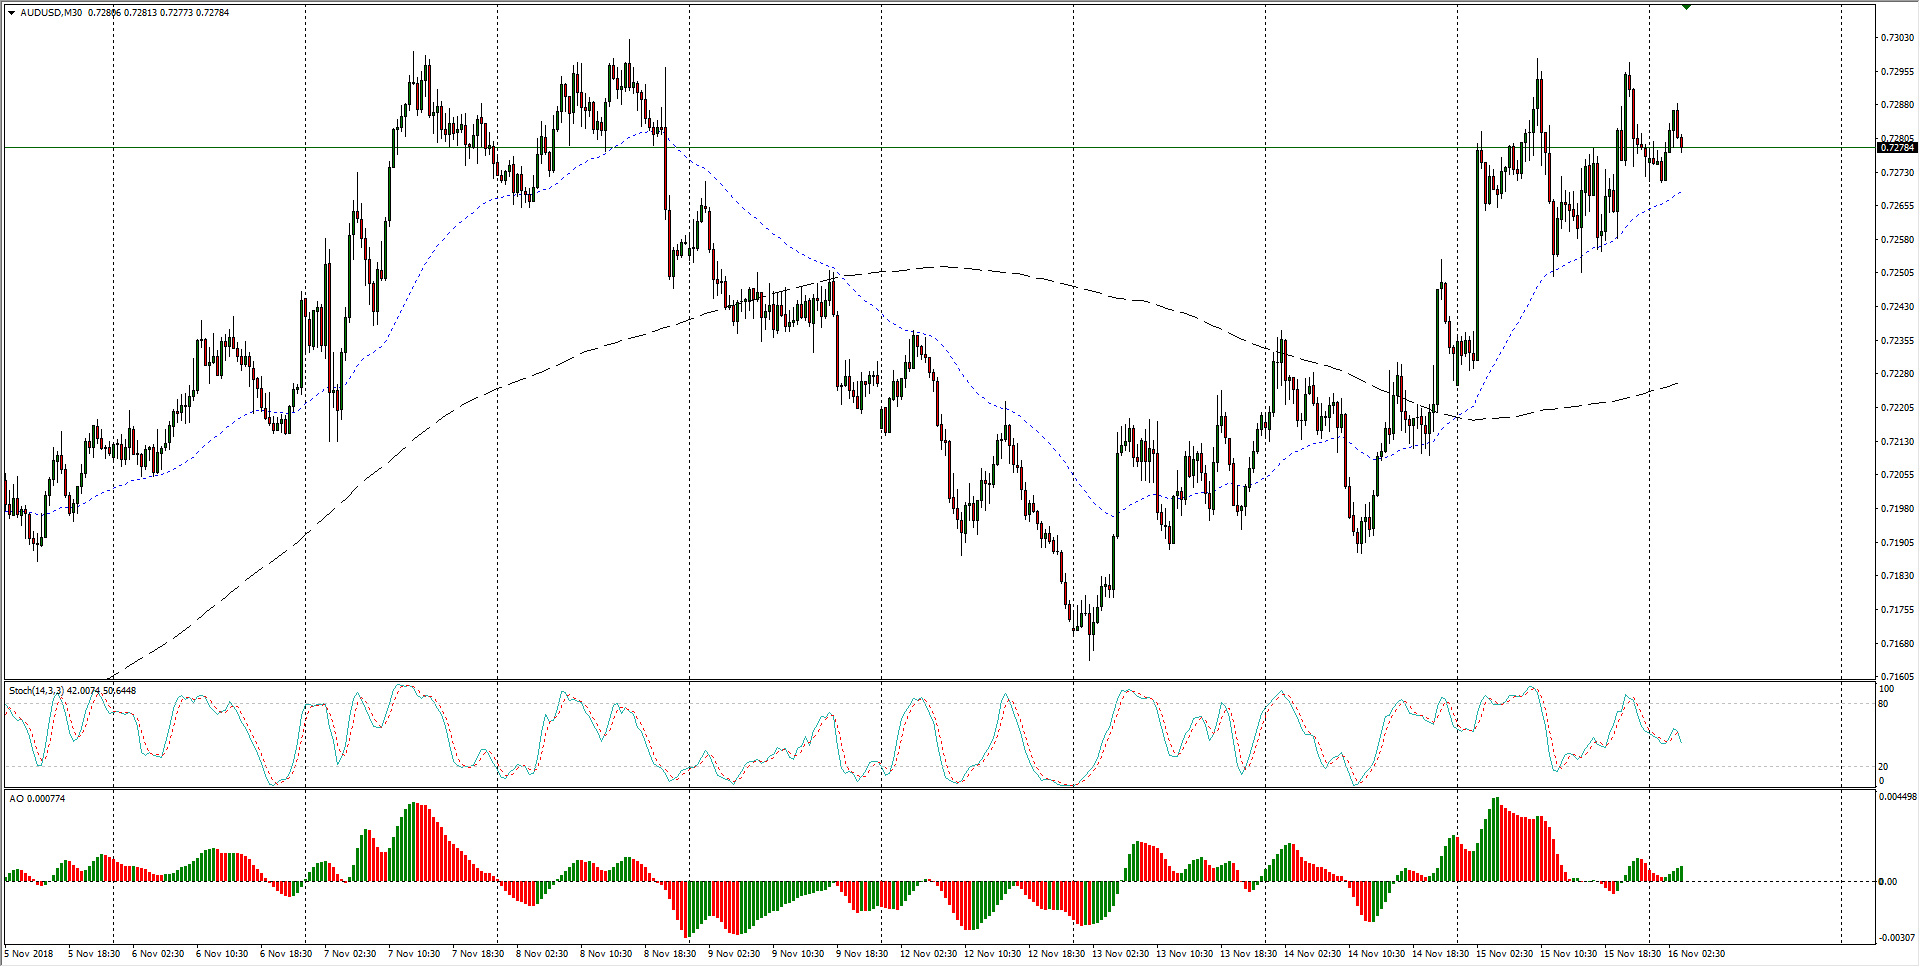
- The past two weeks sees the AUD/USD’s latest bull move facing potential rejection from that pair’s last swing high into the 0.7300 region, and buyers are risking a stall-out if they don’t keep the pair propped up beyond the last higher low at 0.7250.
AUD/USD Chart, 30-Minute
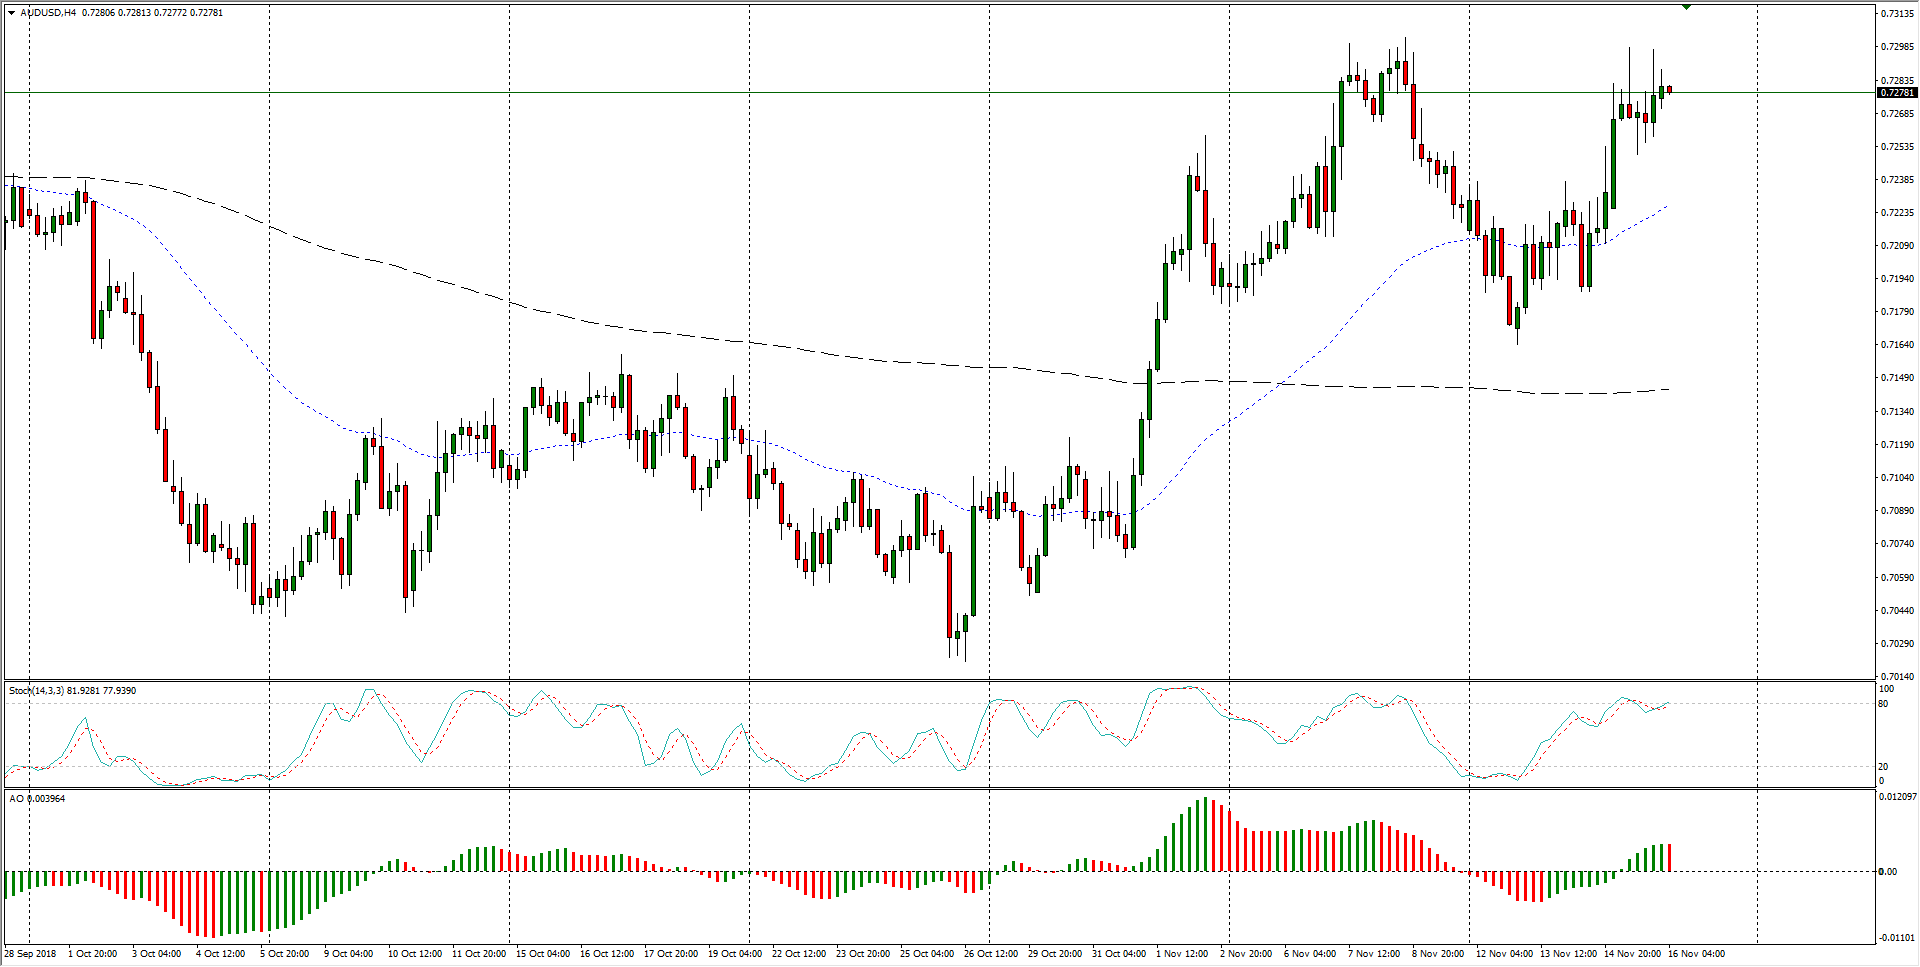
- A flatlining H4 candlestick chart likewise brings poor news for Aussie bidders, with the 200-period moving average nearly perfectly horizontal from 0.7140, with only thin support coming from the 50-period MA at 0.7225.
AUD/USD Chart, 4-Hour
AUD/USD
Overview:
Last Price: 0.7286
Daily change: 7.0 pips
Daily change: 0.0962%
Daily Open: 0.7279
Trends:
Daily SMA20: 0.7163
Daily SMA50: 0.7163
Daily SMA100: 0.7257
Daily SMA200: 0.7456
Levels:
Daily High: 0.73
Daily Low: 0.7226
Weekly High: 0.7304
Weekly Low: 0.7183
Monthly High: 0.724
Monthly Low: 0.702
Daily Fibonacci 38.2%: 0.7272
Daily Fibonacci 61.8%: 0.7255
Daily Pivot Point S1: 0.7237
Daily Pivot Point S2: 0.7195
Daily Pivot Point S3: 0.7164
Daily Pivot Point R1: 0.7311
Daily Pivot Point R2: 0.7342
Daily Pivot Point R3: 0.7384
