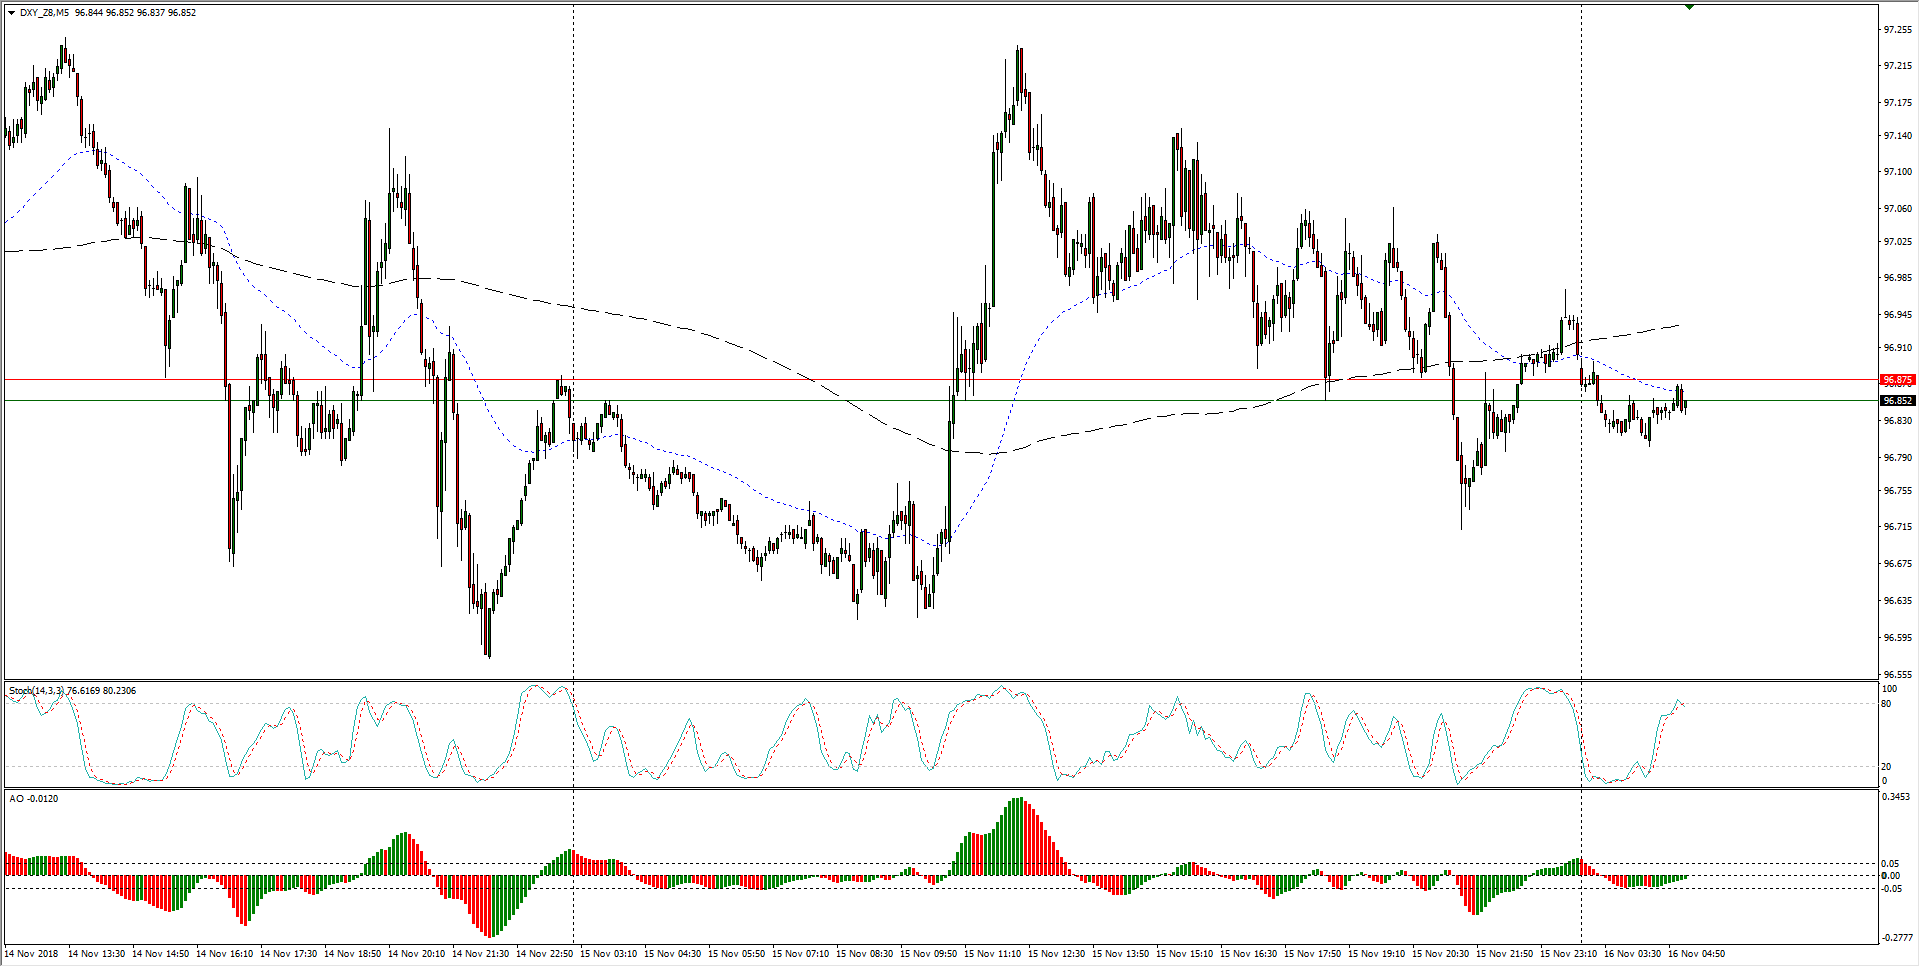
- The US Dollar remains constrained under intraday whips across the broader FX space, keeping the Greenback under wraps from yesterday’s peak at 74.25
DXY Chart, 5-Minute
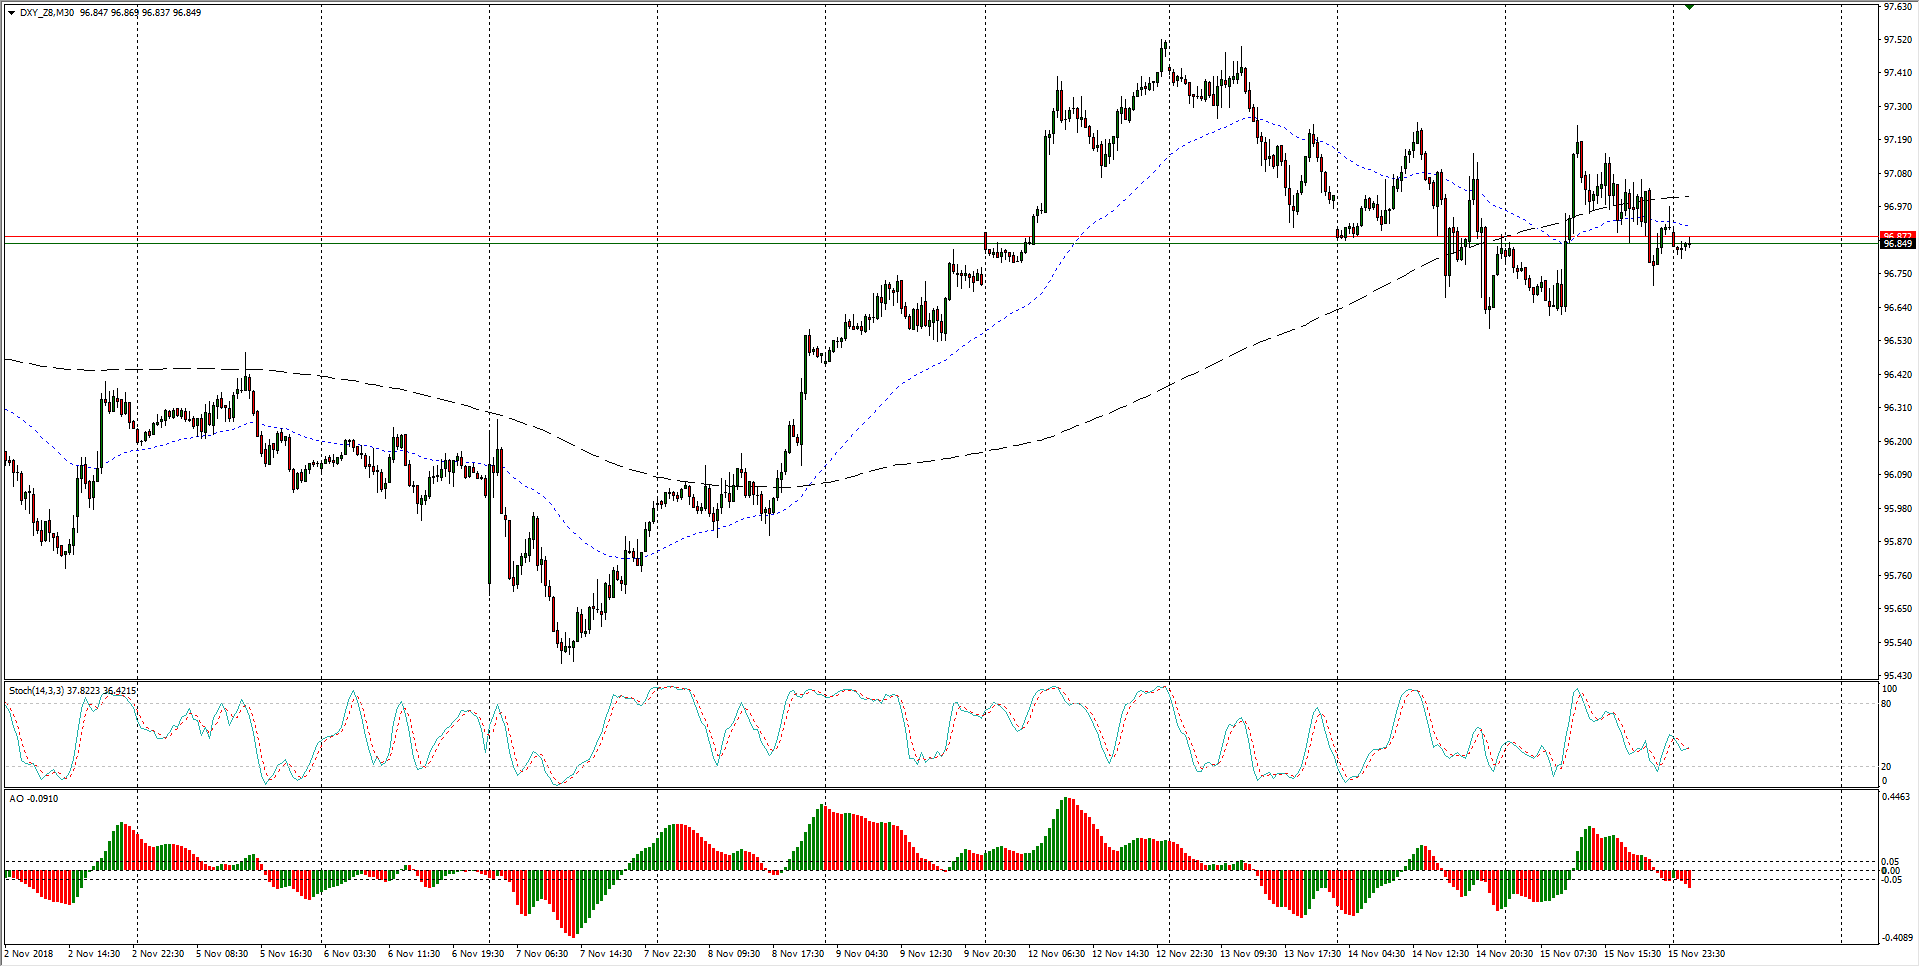
- Looking further out to the past two weeks, a major higher low is running out of time to mark in a floor for the Dollar index, and the 200-period moving average is threating to become a stiff resistance level which could prevent a further move up in the USD.
DXY Chart, 30-Minute
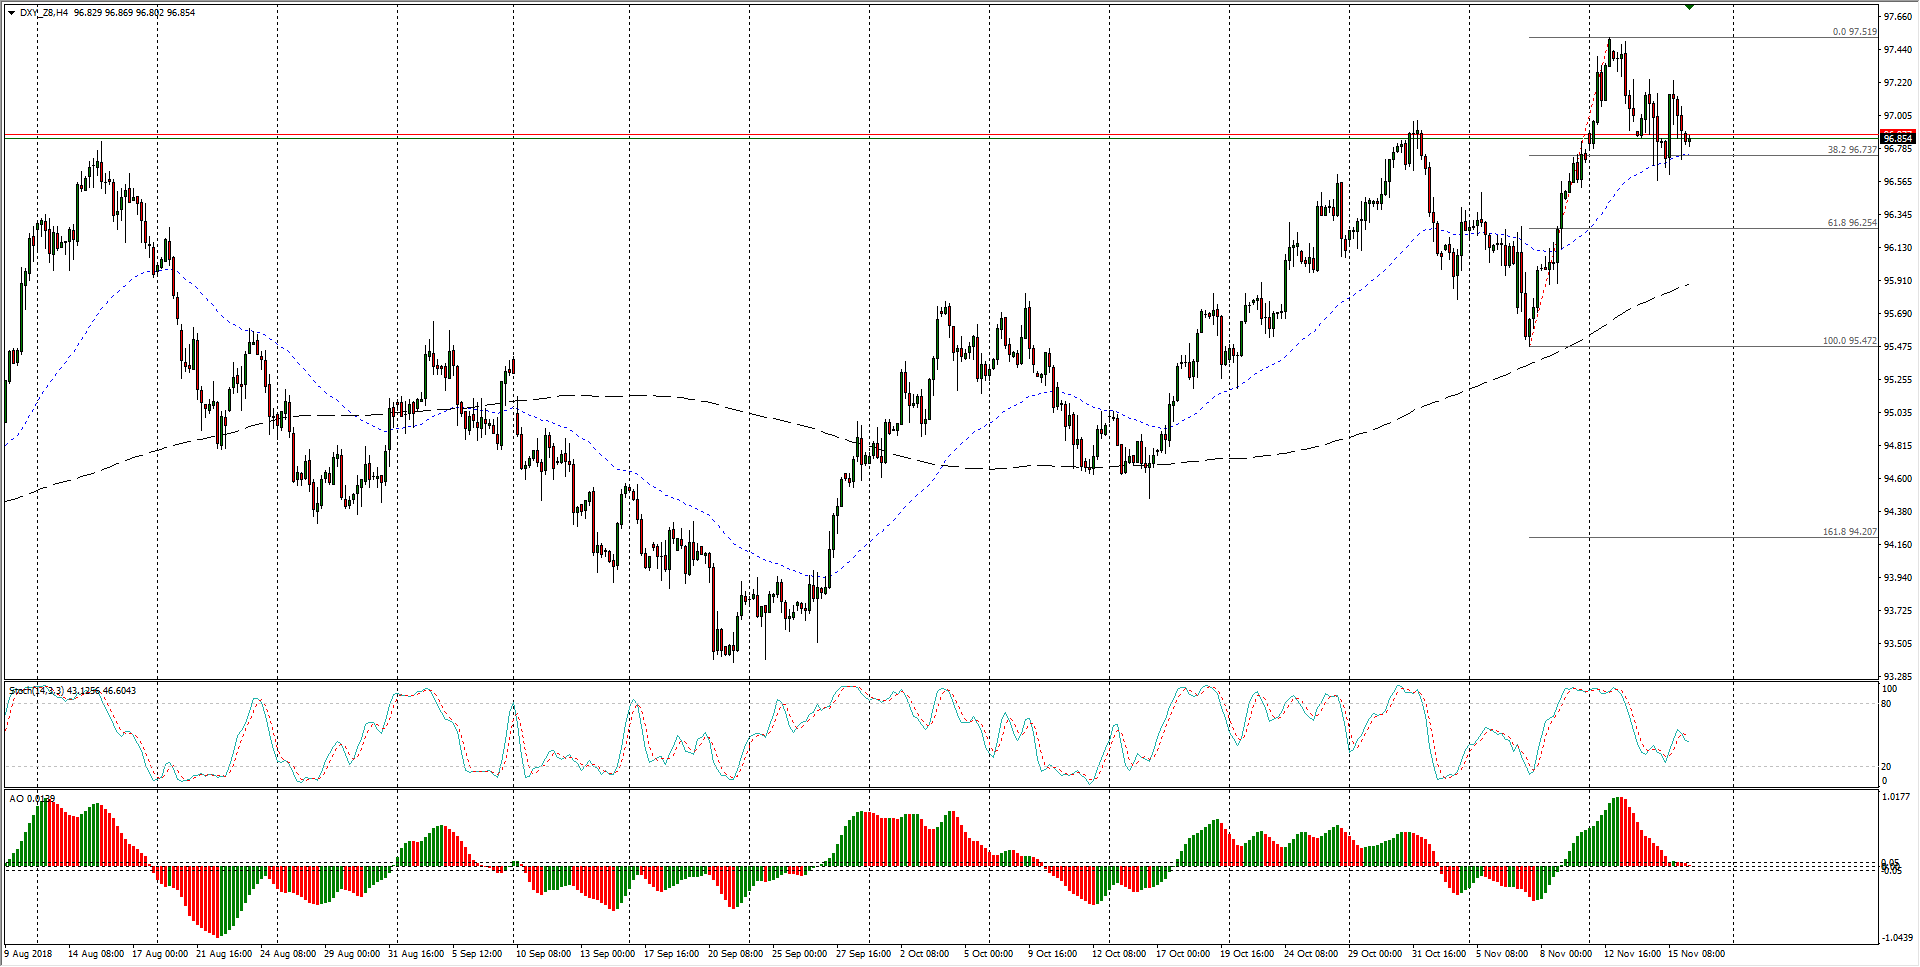
- While the DXY could be due for a bearish correction, the overall trend remains firmly to the bull side, with the DXY’s interim action getting choked out by a failed downside run at the 38.2% Fibo retracement level at 96.75,.
DXY Chart, 4-Hour
Dollar Index Spot
Overview:
Last Price: 96.98
Daily change: -11 pips
Daily change: -0.113%
Daily Open: 97.09
Trends:
Daily SMA20: 96.6
Daily SMA50: 95.68
Daily SMA100: 95.36
Daily SMA200: 93.5
Levels:
Daily High: 97.39
Daily Low: 96.76
Weekly High: 97.01
Weekly Low: 95.68
Monthly High: 97.2
Monthly Low: 94.79
Daily Fibonacci 38.2%: 97.15
Daily Fibonacci 61.8%: 97
Daily Pivot Point S1: 96.77
Daily Pivot Point S2: 96.45
Daily Pivot Point S3: 96.14
Daily Pivot Point R1: 97.4
Daily Pivot Point R2: 97.71
Daily Pivot Point R3: 98.03
