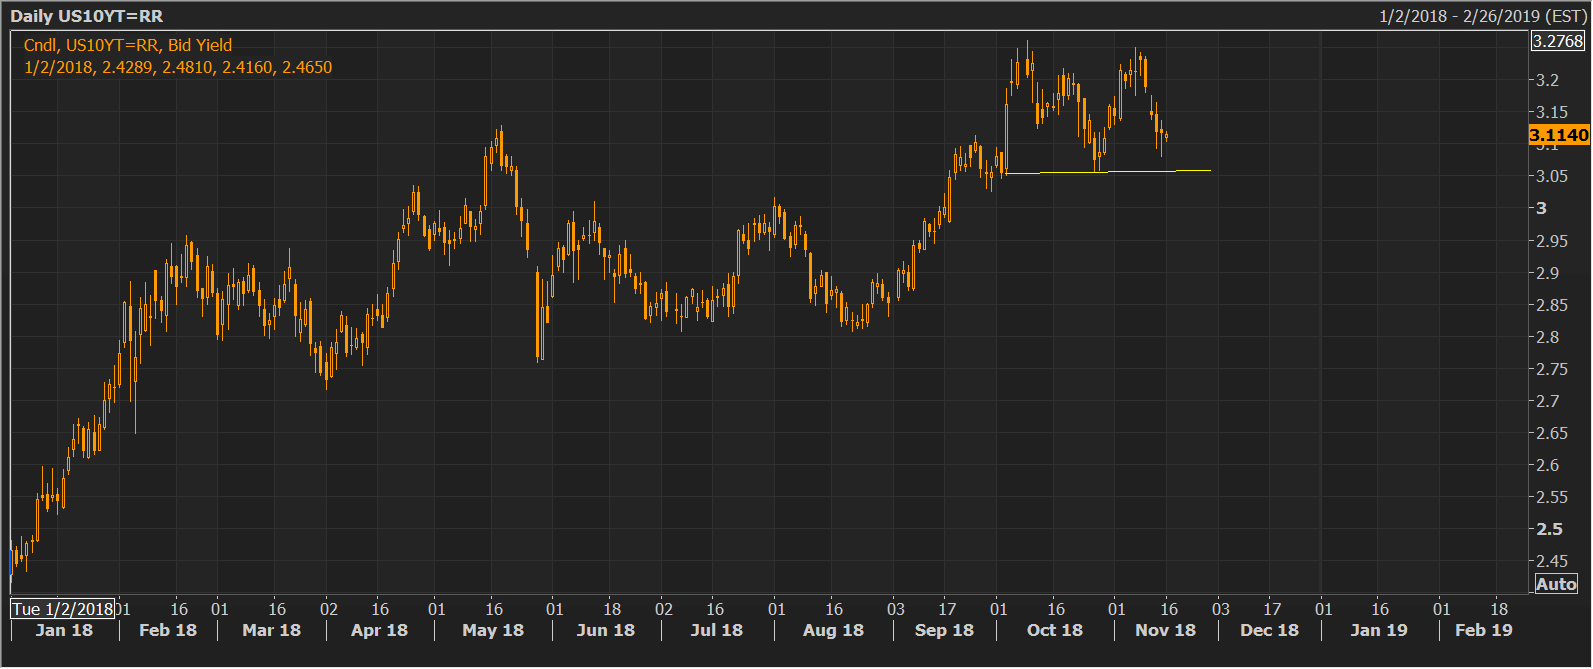
- The US 10-year treasury yield is charting a double top bearish reversal pattern with the neckline at 3.057 percent.
- A daily close below the neckline support would confirm a bullish-to-bearish trend change, opening the doors for a deeper drop to percent (target as per the measured height method).
- The bearish breakdown, if confirmed, could drag the USD/JPY pair lower. The fact that the Treasury yield is charting a bearish reversal pattern could also be considered an indication that risk aversion could worsen in the days ahead.
- Note that the 10-year yield is more sensitive to haven demand compared to the 2-year yield, which is more sensitive to short-term rate hike/inflation expectations.
Daily chart