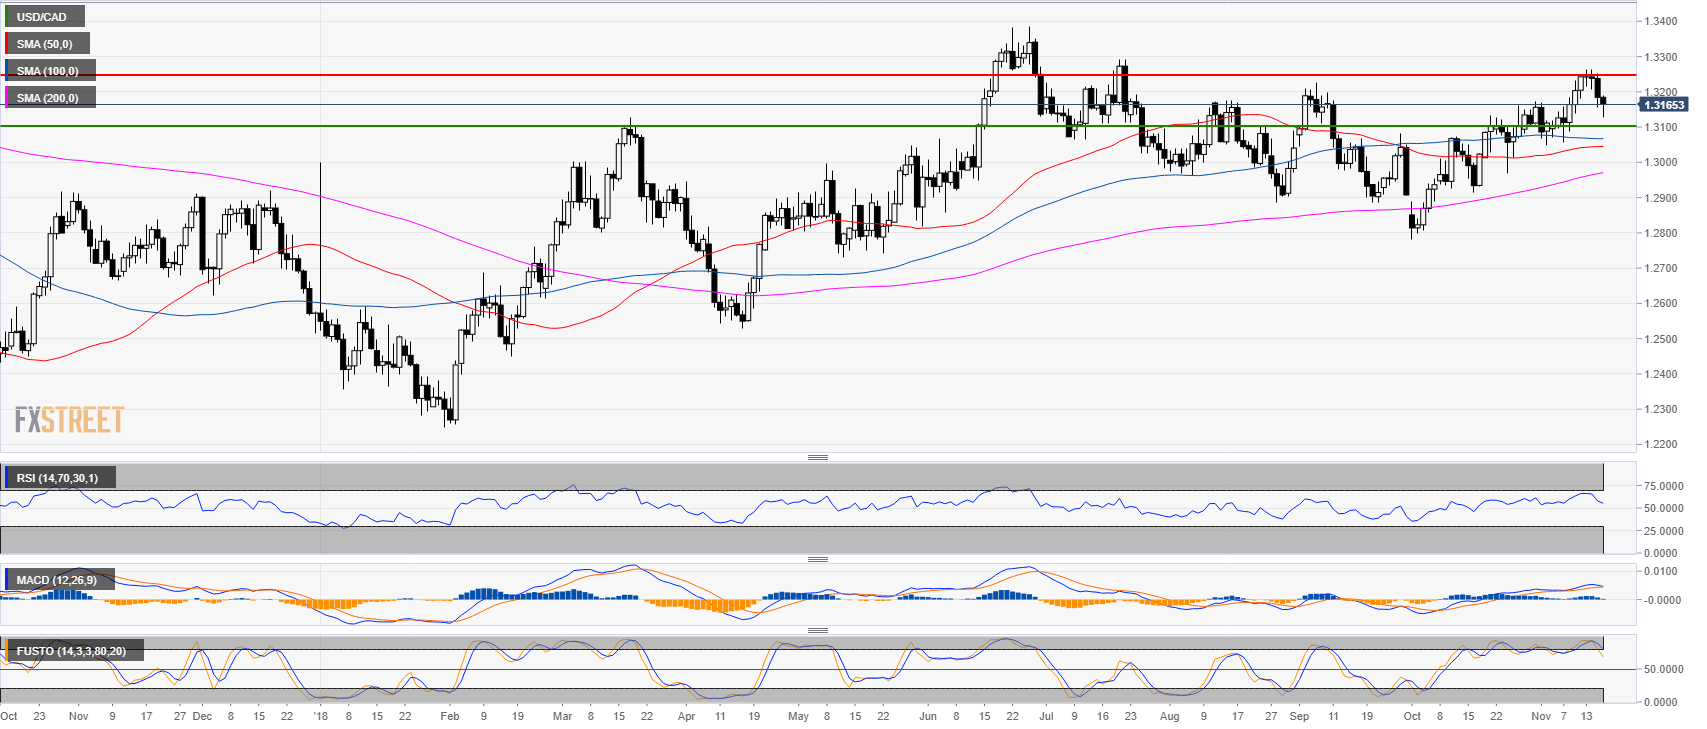
USD/CAD daily chart
- USD/CAD found strong resistance at the 1.3250 level.
- Technical indicators are starting to lose momentum but are still in positive territories.
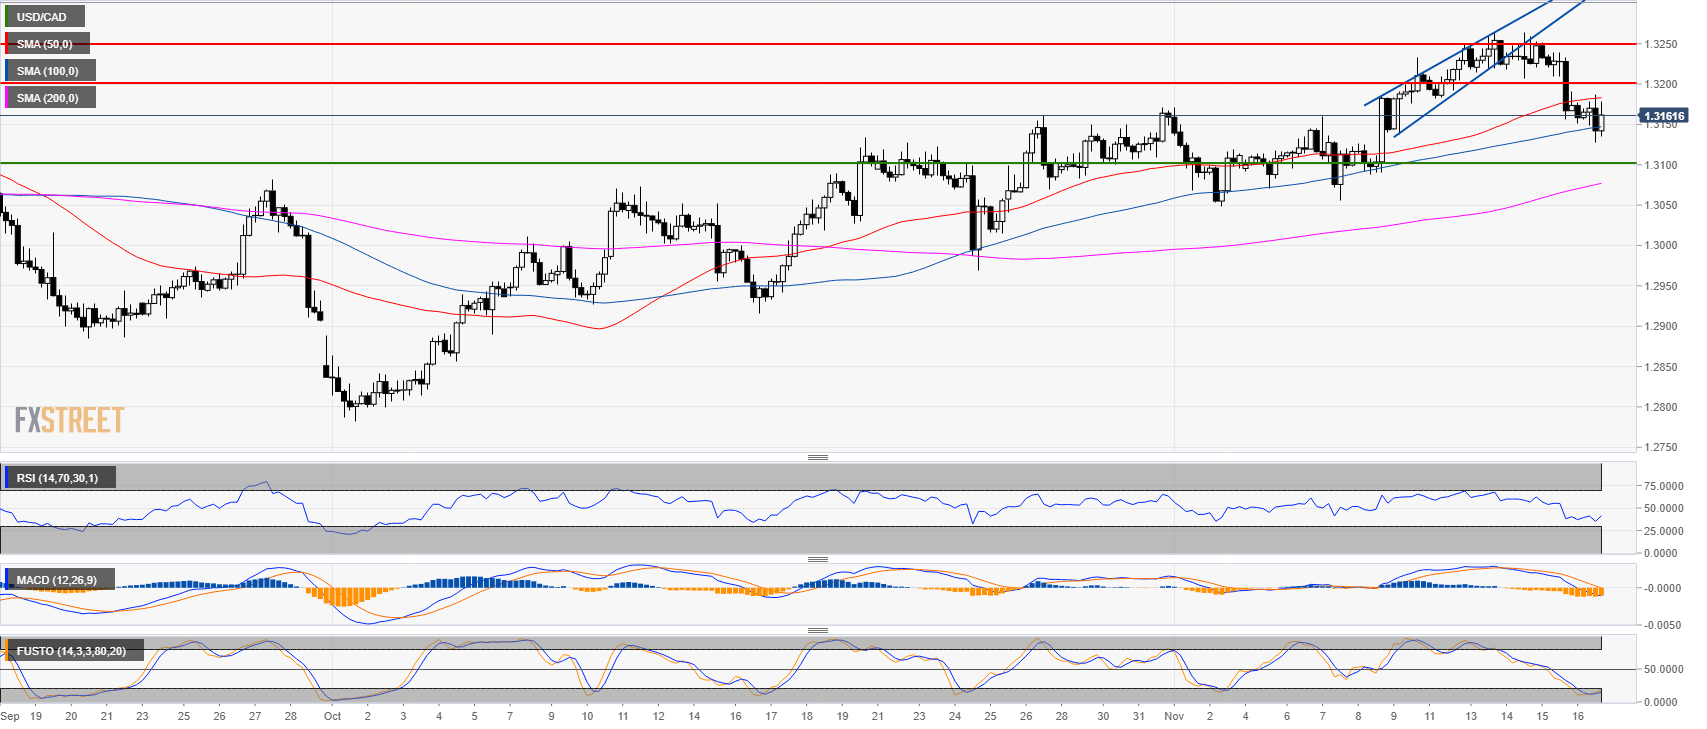
USD/CAD 4-hour chart
- Bears had a strong bear breakout to 1.3150 and the 100-period simple moving average (SMA).
- USD/CAD remains bearish below 1.3200 figure with a target at 1.3100 figure.
USD/CAD 30-minute chart
- USD/CAD is trading below its main SMAs suggesting continued bearish momentum in the near future.
-636779872889495740.png)
Additional key levels at a glance:
USD/CAD
Overview:
Last Price: 1.3164
Daily change: -20 pips
Daily change: -0.152%
Daily Open: 1.3184
Trends:
Daily SMA20: 1.3137
Daily SMA50: 1.3045
Daily SMA100: 1.3068
Daily SMA200: 1.2963
Levels:
Daily High: 1.3253
Daily Low: 1.3156
Weekly High: 1.3233
Weekly Low: 1.3056
Monthly High: 1.3172
Monthly Low: 1.2783
Daily Fibonacci 38.2%: 1.3193
Daily Fibonacci 61.8%: 1.3216
Daily Pivot Point S1: 1.3143
Daily Pivot Point S2: 1.3101
Daily Pivot Point S3: 1.3046
Daily Pivot Point R1: 1.3239
Daily Pivot Point R2: 1.3294
Daily Pivot Point R3: 1.3336
