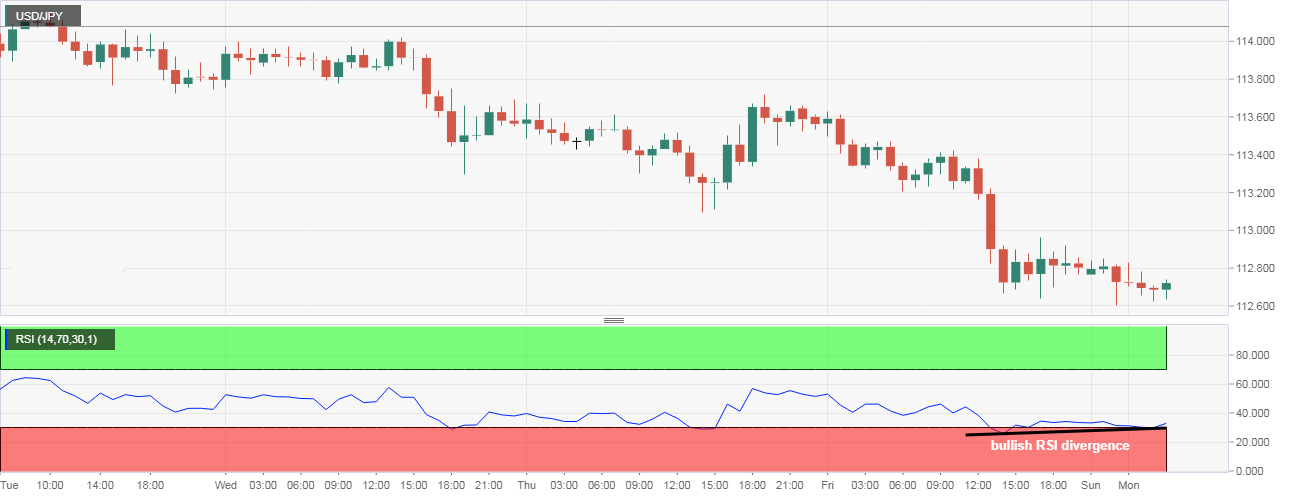
- The USD/JPY opened under the 50-day simple moving average (SMA) and hit a low of 112.61 earlier today – the lowest level since Nov. – possibly due to signs of risk aversion in the S&P 500 futures.
- The relative strength index (RSI) on the 4-hour chart and the hourly chart is reporting oversold conditions. As a result, the pair could consolidate or may see a minor bounce to the 50-day SMA of 112.84.
- The 14-day RSI has dipped into bearish territory below 50.00 and the 5-day and 10-day SMAs are showing a bearish crossover. The stacking order of the 50-hour SMA below the 100-hour SMA, below the 200-hour SMA, also indicates the path of least resistance is on the downside.
- So, minor pullback, if any, as called by the hourly and 4-hour RSI, could be short-lived.
Hourly Chart
USD/JPY
Overview:
Last Price: 112.65
Daily change: -15 pips
Daily change: -0.133%
Daily Open: 112.8
Trends:
Daily SMA20: 113.08
Daily SMA50: 112.82
Daily SMA100: 112.03
Daily SMA200: 110.14
Levels:
Daily High: 113.66
Daily Low: 112.64
Weekly High: 114.22
Weekly Low: 112.64
Monthly High: 114.56
Monthly Low: 111.38
Daily Fibonacci 38.2%: 113.03
Daily Fibonacci 61.8%: 113.27
Daily Pivot Point S1: 112.41
Daily Pivot Point S2: 112.01
Daily Pivot Point S3: 111.39
Daily Pivot Point R1: 113.43
Daily Pivot Point R2: 114.05
Daily Pivot Point R3: 114.45
