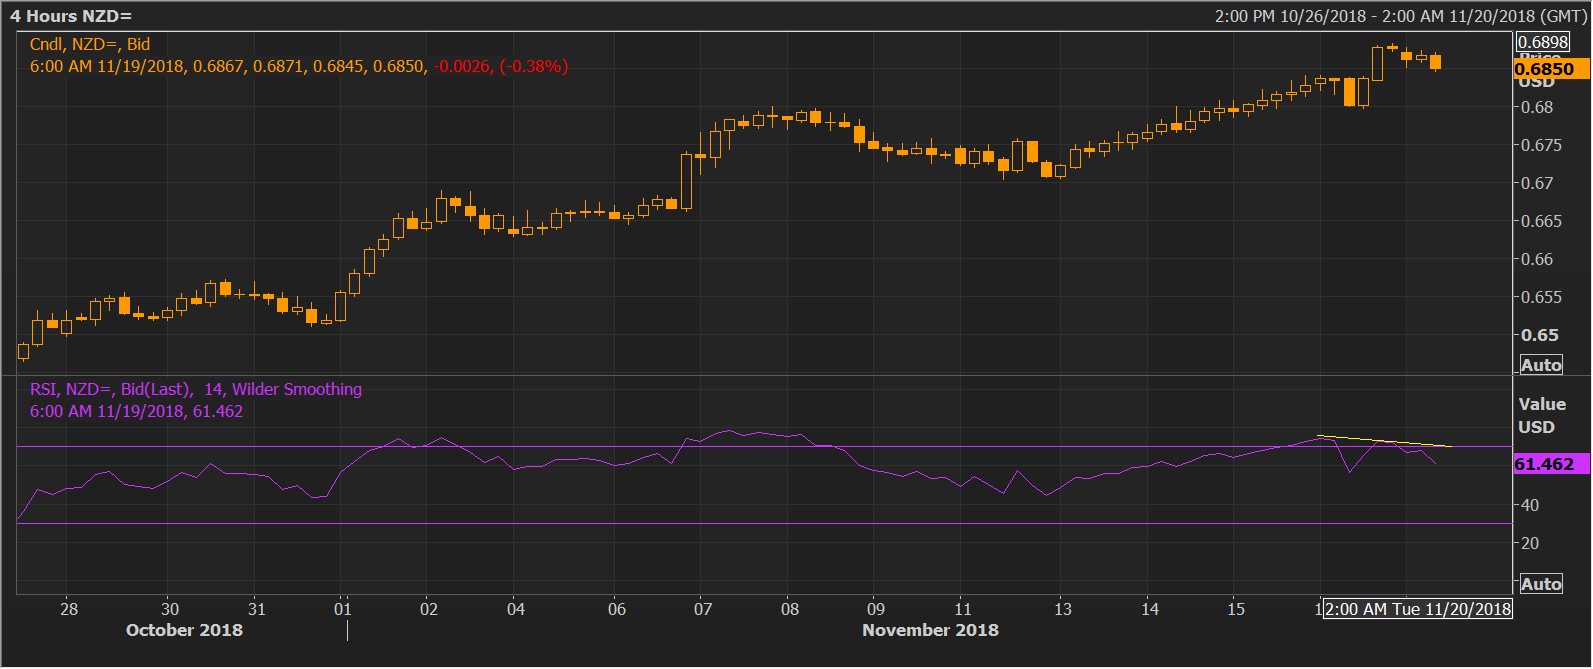
- The NZD/USD pair is currently trading at 0.6852, down 0.45 percent from Friday’s high of 0.6883, and could witness a deeper pullback to ascending (bullish) 5-day EMA of 0.6822, as the 4-hour chart is showing a bearish divergence of the relative strength index.
- The pullback could be short-lived as the both 5- and 10-day EMAs are trending north, indicating a bullish setup.
- A daily close below the ascending 10-day EMA would invalidate the bullish setup, allowing a short-term consolidation.
4-hour chart
Trend: Pullback likely
NZD/USD
Overview:
Last Price: 0.6854
Daily change: -27 pips
Daily change: -0.392%
Daily Open: 0.6881
Trends:
Daily SMA20: 0.6658
Daily SMA50: 0.6601
Daily SMA100: 0.6657
Daily SMA200: 0.6892
Levels:
Daily High: 0.6884
Daily Low: 0.6798
Weekly High: 0.6884
Weekly Low: 0.6706
Monthly High: 0.663
Monthly Low: 0.6424
Daily Fibonacci 38.2%: 0.6851
Daily Fibonacci 61.8%: 0.6831
Daily Pivot Point S1: 0.6825
Daily Pivot Point S2: 0.6769
Daily Pivot Point S3: 0.674
Daily Pivot Point R1: 0.6911
Daily Pivot Point R2: 0.694
Daily Pivot Point R3: 0.6996
