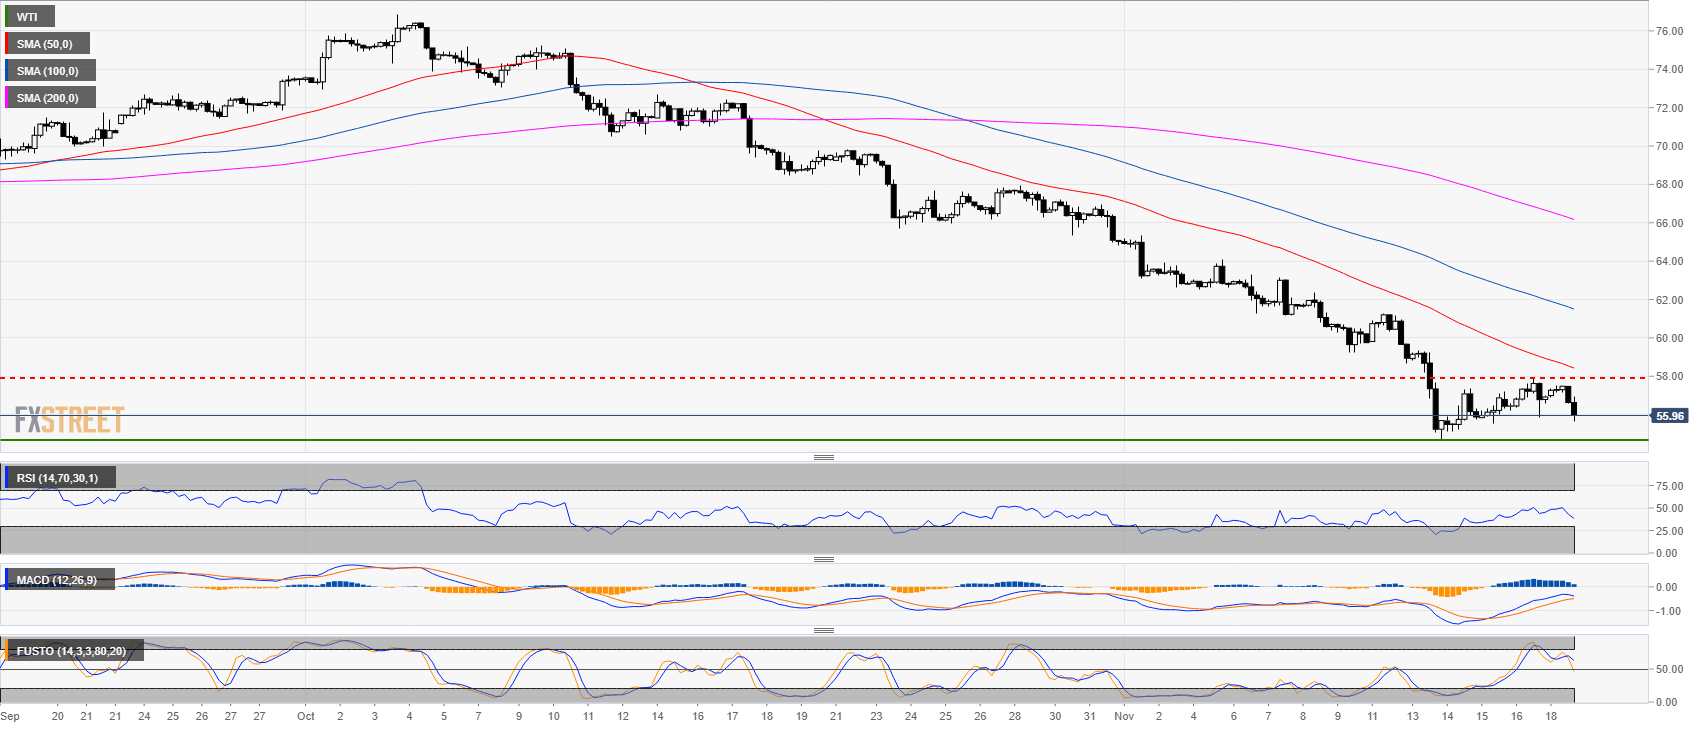
Crude oil 4-hour chart
- Crude oil is trading in a bear trend below the 200-period simple moving average.
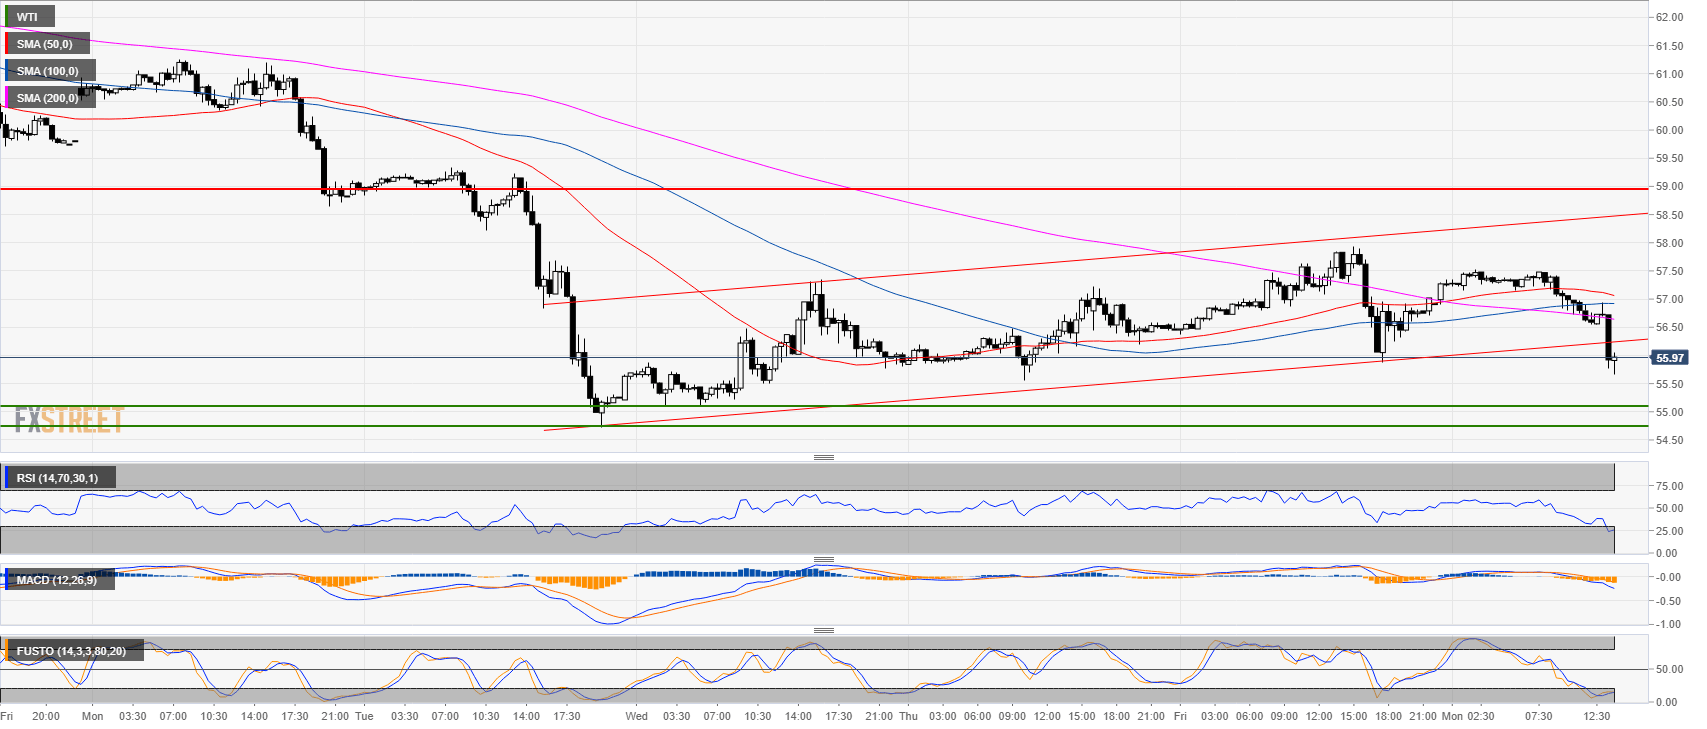
Crude oil 30-minute chart
- Crude oil bears broke below the bear channel.
- Technical indicators are in the oversold zone suggesting that the bear move will be limited.
- 55.00 figure and 54.73 (2018 low) should be a very strong support to break.
Additional key levels at a glance:
WTI
Overview:
Last Price: 55.98
Daily change: -1.3e+2 pips
Daily change: -2.25%
Daily Open: 57.27
Trends:
Daily SMA20: 61.57
Daily SMA50: 67.7
Daily SMA100: 68.03
Daily SMA200: 68.23
Levels:
Daily High: 57.34
Daily Low: 56.9
Weekly High: 60.93
Weekly Low: 55.21
Monthly High: 76.25
Monthly Low: 64.86
Daily Fibonacci 38.2%: 57.17
Daily Fibonacci 61.8%: 57.07
Daily Pivot Point S1: 57
Daily Pivot Point S2: 56.73
Daily Pivot Point S3: 56.56
Daily Pivot Point R1: 57.44
Daily Pivot Point R2: 57.61
Daily Pivot Point R3: 57.88
