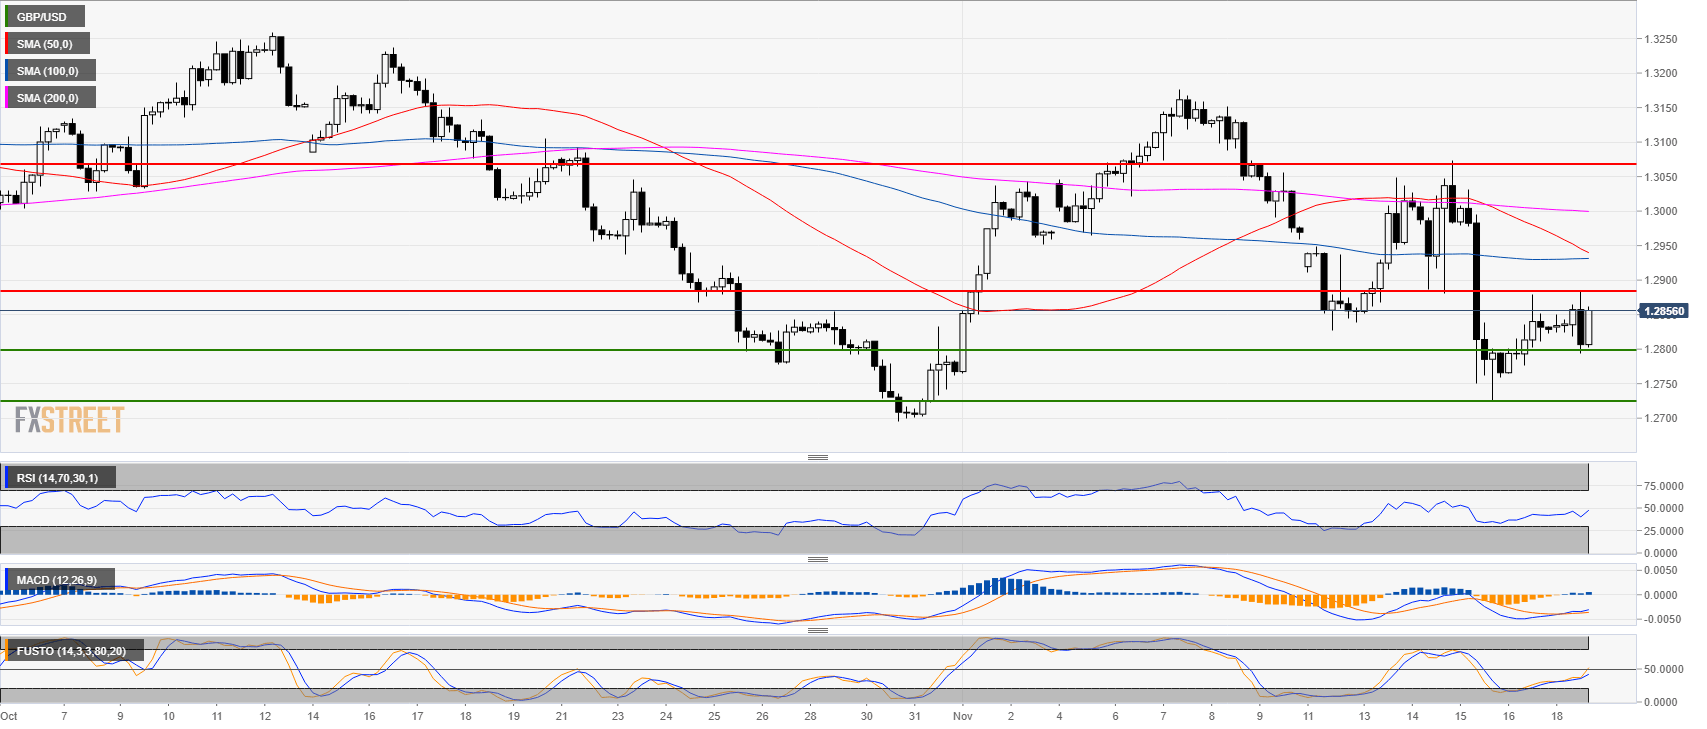
GBP/USD 4-hour chart
- GBP/USD is trading in a bear trend below the 200-period simple moving average.
GBP/USD 30-minute chart
- GBP/USD is weakening below the 1.2880 level as technical indicators are decelerating.
- GBP/USD is set to trade sideways to down in the rest of the New York session with 1.2800 as an intraday support.
- A break of 1.2800 should lead to a move to 1.2723, November 15 low.
-636782373462108073.png)
Additional key levels at a glance:
GBP/USD
Overview:
Last Price: 1.2827
Daily change: -2.0 pips
Daily change: -0.0156%
Daily Open: 1.2829
Trends:
Daily SMA20: 1.2922
Daily SMA50: 1.3031
Daily SMA100: 1.3019
Daily SMA200: 1.3374
Levels:
Daily High: 1.2878
Daily Low: 1.2759
Weekly High: 1.3074
Weekly Low: 1.2724
Monthly High: 1.326
Monthly Low: 1.2696
Daily Fibonacci 38.2%: 1.2833
Daily Fibonacci 61.8%: 1.2805
Daily Pivot Point S1: 1.2765
Daily Pivot Point S2: 1.2702
Daily Pivot Point S3: 1.2646
Daily Pivot Point R1: 1.2885
Daily Pivot Point R2: 1.2942
Daily Pivot Point R3: 1.3005
