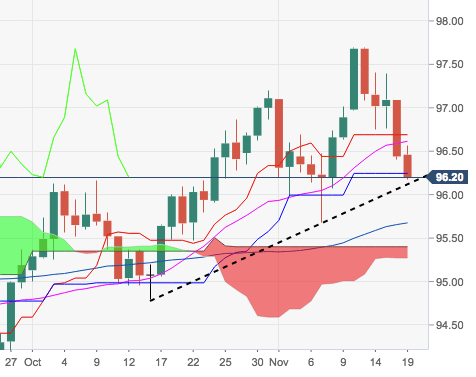
- The greenback is adding to last week’s losses and is now dragging DXY to print multi-day lows in the 96.30/20 band.
- The index is losing further momentum and is eroding the immediate support line, threatening at the same time to extend the pullback to the critical 96.00 area.
- In the meantime, the 96.00 neighbourhood is expected to hold the downside, where converges early October highs and the 50% Fibo of the 2017-2018 drop.
DXY daily chart
Dollar Index Spot
Overview:
Last Price: 96.18
Daily change: -26 pips
Daily change: -0.270%
Daily Open: 96.44
Trends:
Daily SMA20: 96.64
Daily SMA50: 95.7
Daily SMA100: 95.38
Daily SMA200: 93.53
Levels:
Daily High: 97.09
Daily Low: 96.4
Weekly High: 97.7
Weekly Low: 96.4
Monthly High: 97.2
Monthly Low: 94.79
Daily Fibonacci 38.2%: 96.66
Daily Fibonacci 61.8%: 96.83
Daily Pivot Point S1: 96.2
Daily Pivot Point S2: 95.95
Daily Pivot Point S3: 95.51
Daily Pivot Point R1: 96.89
Daily Pivot Point R2: 97.33
Daily Pivot Point R3: 97.58
