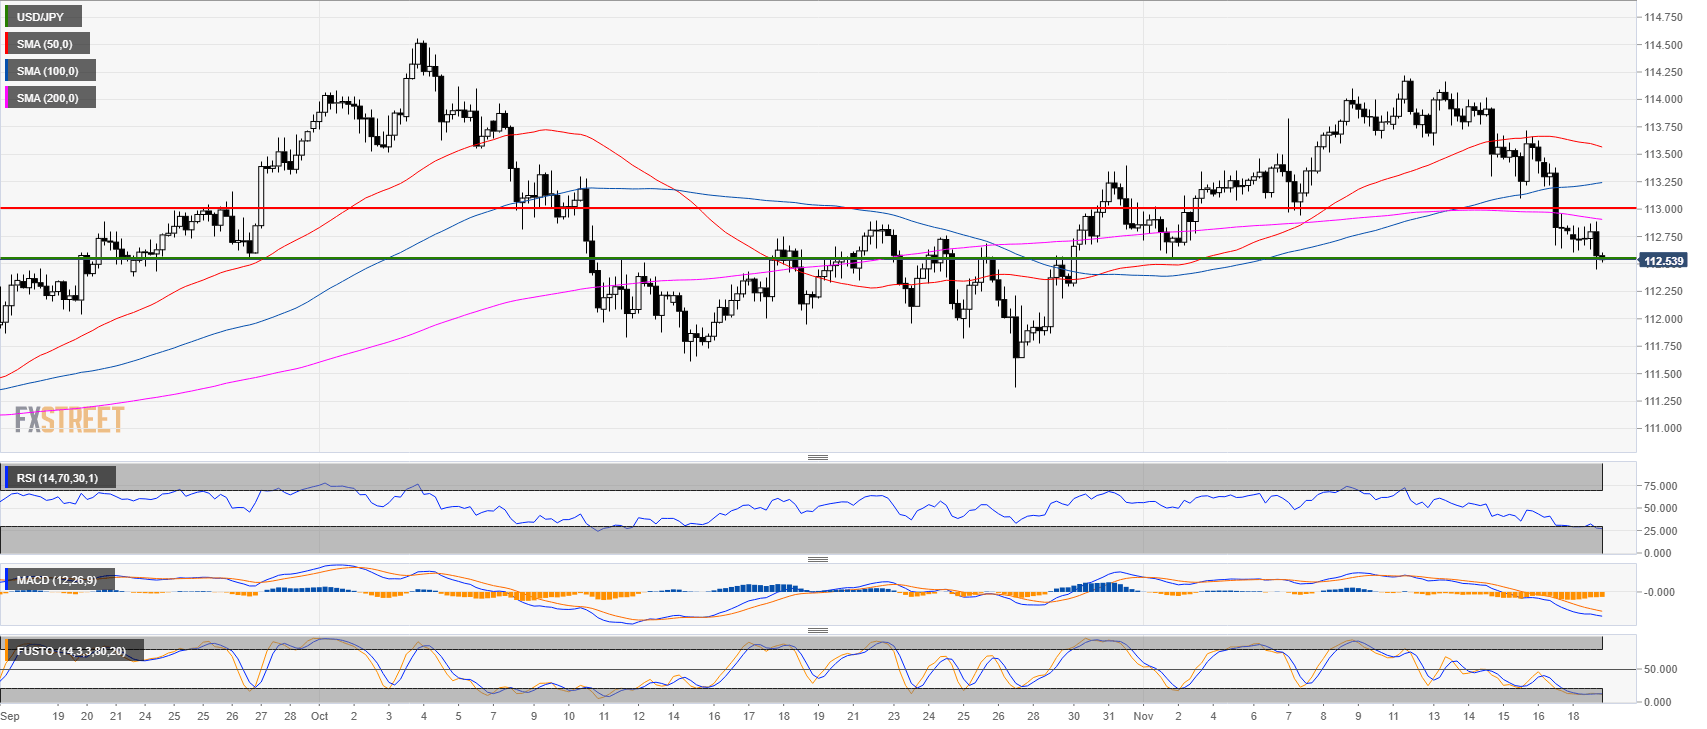
USD/JPY 4-hour chart
- USD/JPY is trading in a bear trend below the 200-period simple moving average.
- USD/JPY is testing 112.55 support.
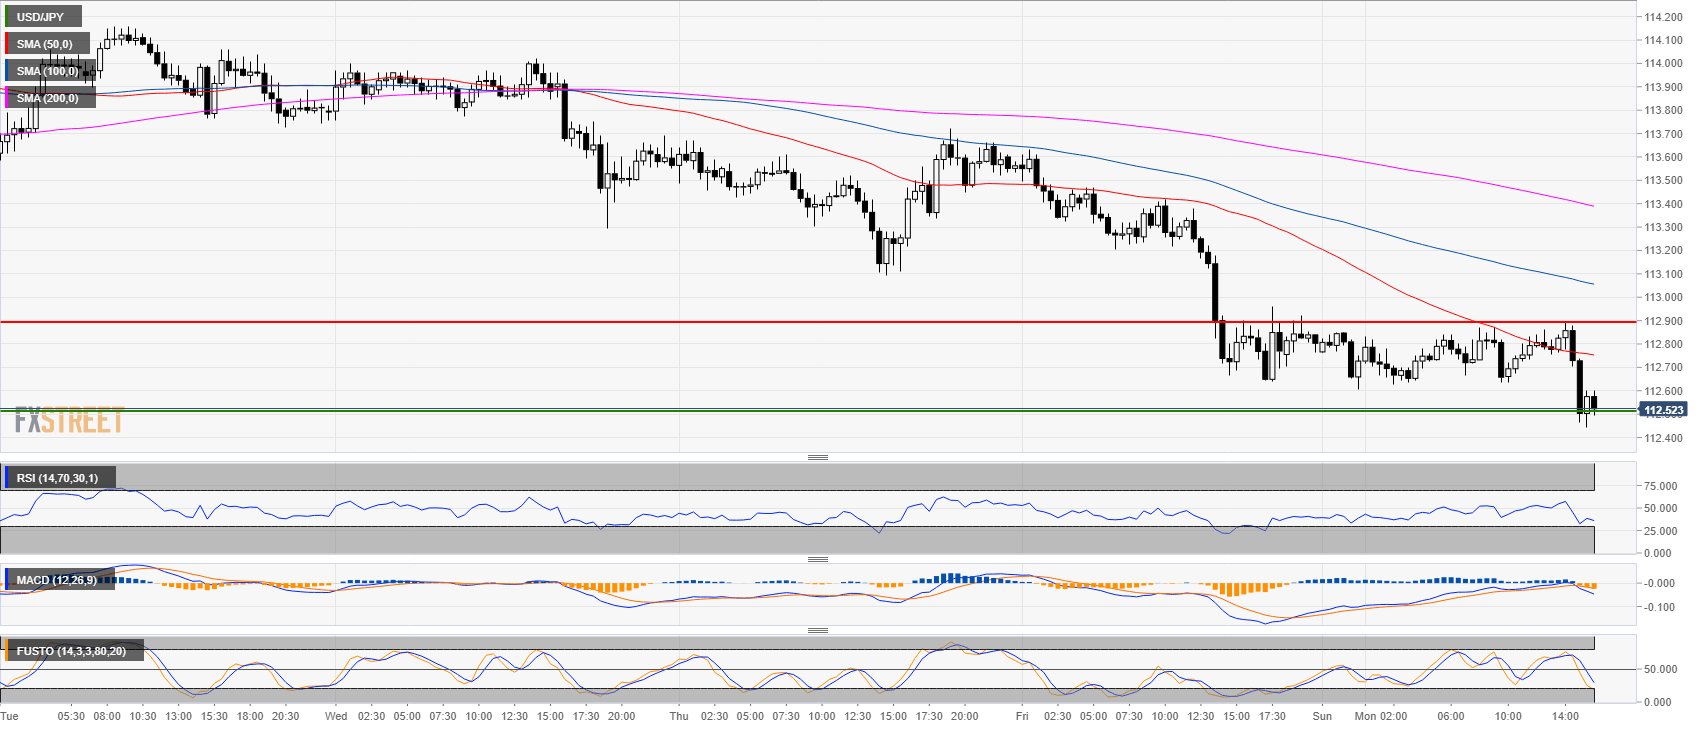
USD/JPY 30-minute chart
- The bears need to break below 112.55 support in order to reach 112.00 level.
- Failure to break below 112.55 can lead to a reversal up to 112.90 resistance.
Additional key levels at a glance:
USD/JPY
Overview:
Last Price: 112.52
Daily change: -28 pips
Daily change: -0.248%
Daily Open: 112.8
Trends:
Daily SMA20: 113.08
Daily SMA50: 112.82
Daily SMA100: 112.03
Daily SMA200: 110.14
Levels:
Daily High: 113.66
Daily Low: 112.64
Weekly High: 114.22
Weekly Low: 112.64
Monthly High: 114.56
Monthly Low: 111.38
Daily Fibonacci 38.2%: 113.03
Daily Fibonacci 61.8%: 113.27
Daily Pivot Point S1: 112.41
Daily Pivot Point S2: 112.01
Daily Pivot Point S3: 111.39
Daily Pivot Point R1: 113.43
Daily Pivot Point R2: 114.05
Daily Pivot Point R3: 114.45
