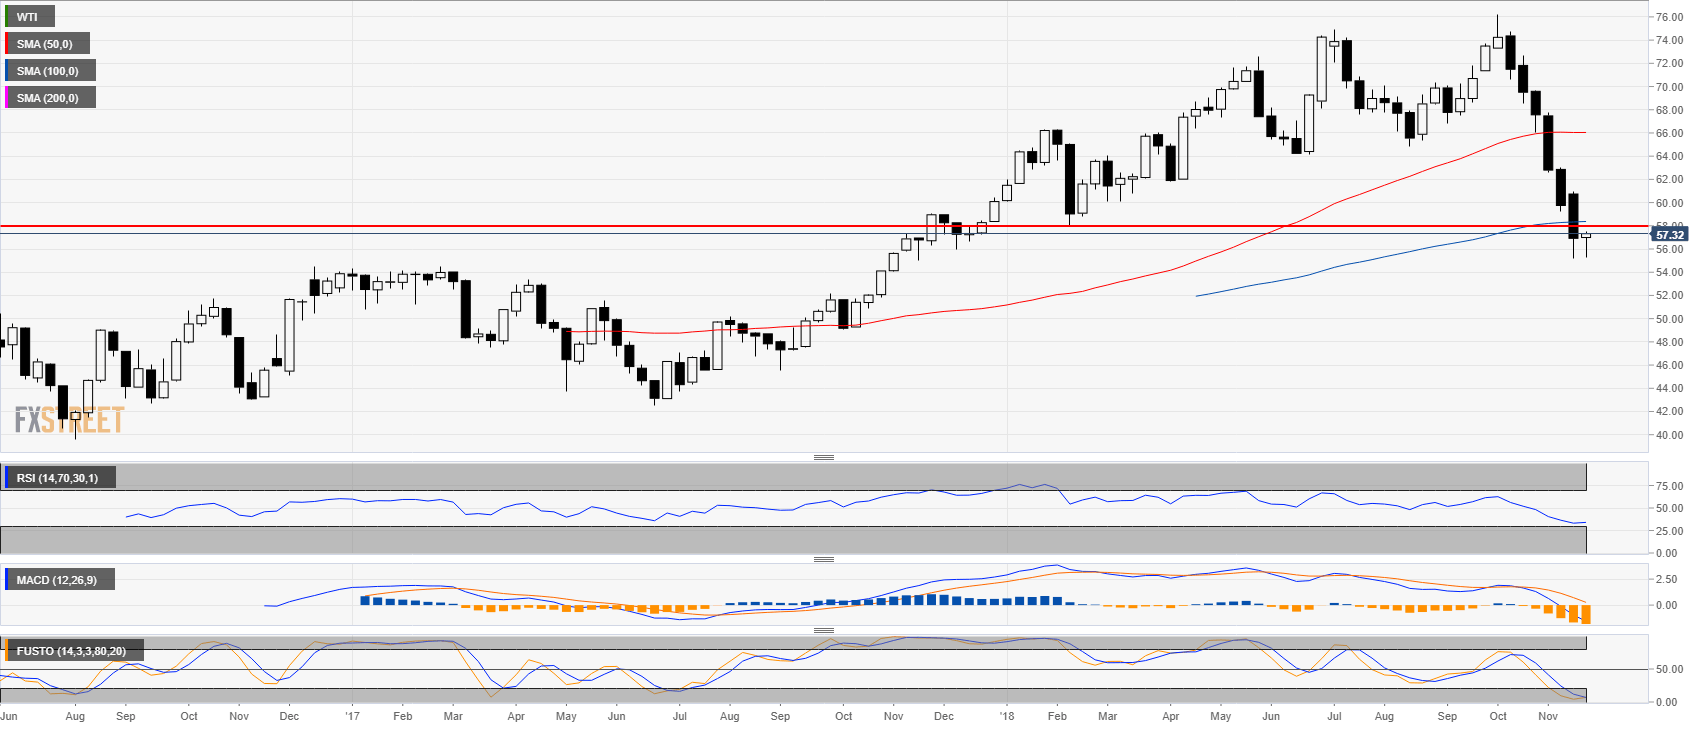
Crude Oil weekly chart
- Crude oil is in a steep bear trend as it erased the yearly gains.
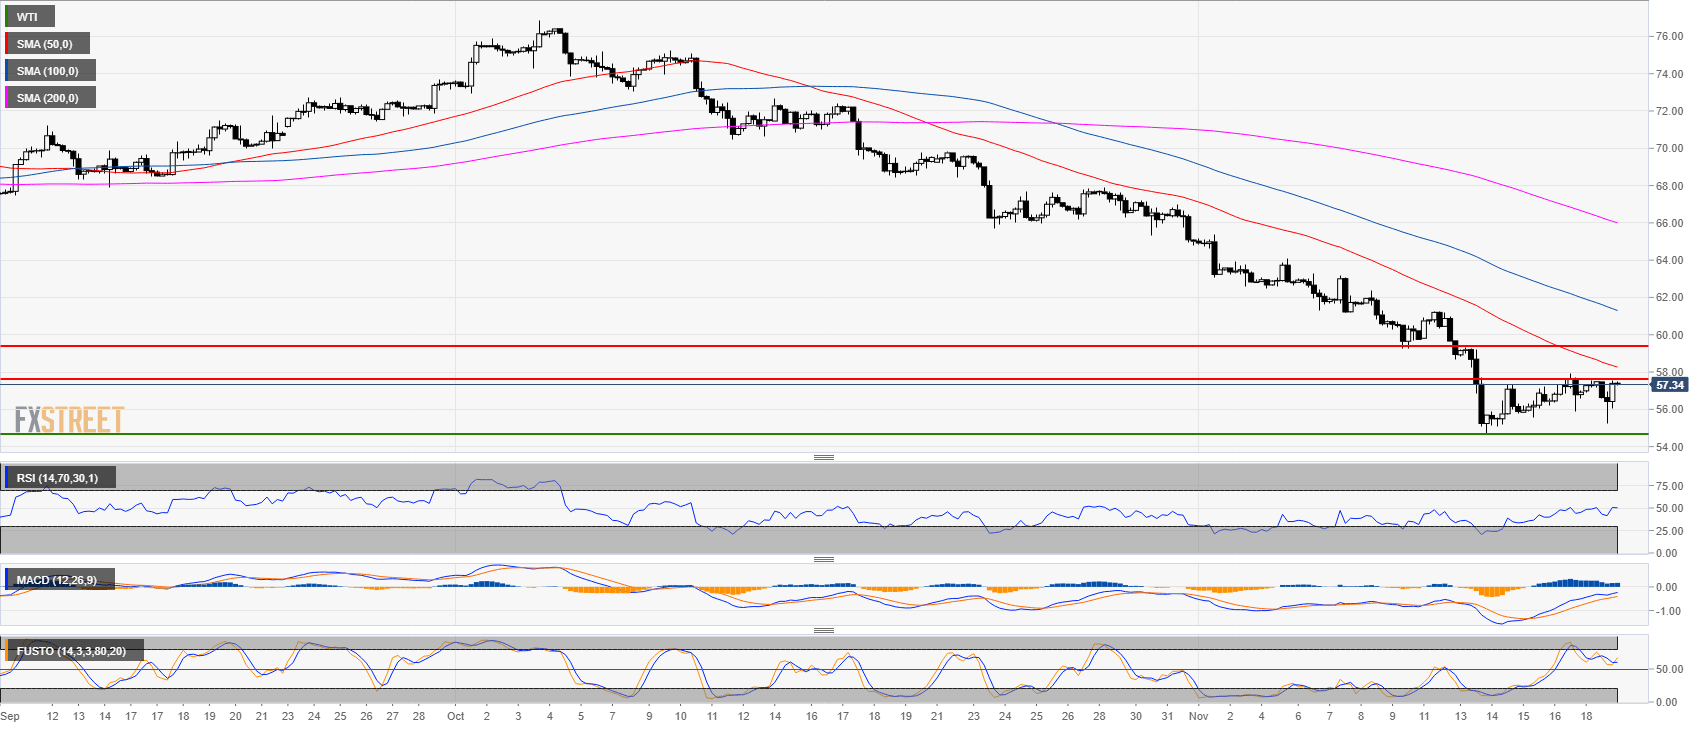
Crude Oil 4-hour chart
- Oil is trading is a sideways consolidation at yearly lows.
- The RSI, MACD and Stochastic indicators are constructive to the upside.
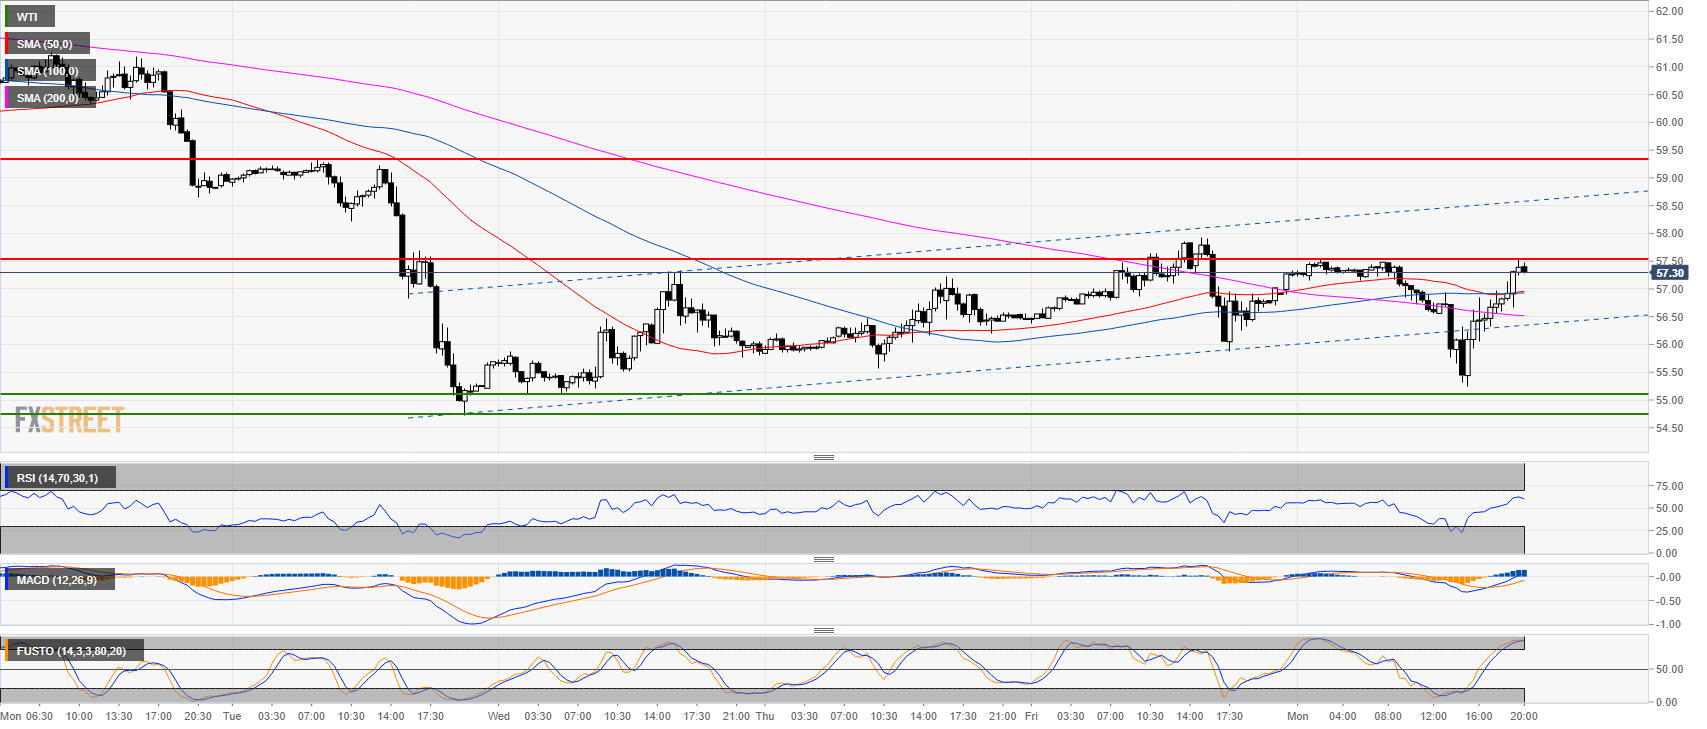
Crude oil 30-minute chart
- As expected oil found support just above 55.00 figure.
- Oil is back into the channel.
- The resistance to break is at 57.55. A move beyond would open the doors to 59.33
Additional key levels at a glance:
WTI
Overview:
Last Price: 57.32
Daily change: 5.0 pips
Daily change: 0.0873%
Daily Open: 57.27
Trends:
Daily SMA20: 61.57
Daily SMA50: 67.7
Daily SMA100: 68.03
Daily SMA200: 68.23
Levels:
Daily High: 57.34
Daily Low: 56.9
Weekly High: 60.93
Weekly Low: 55.21
Monthly High: 76.25
Monthly Low: 64.86
Daily Fibonacci 38.2%: 57.17
Daily Fibonacci 61.8%: 57.07
Daily Pivot Point S1: 57
Daily Pivot Point S2: 56.73
Daily Pivot Point S3: 56.56
Daily Pivot Point R1: 57.44
Daily Pivot Point R2: 57.61
Daily Pivot Point R3: 57.88
