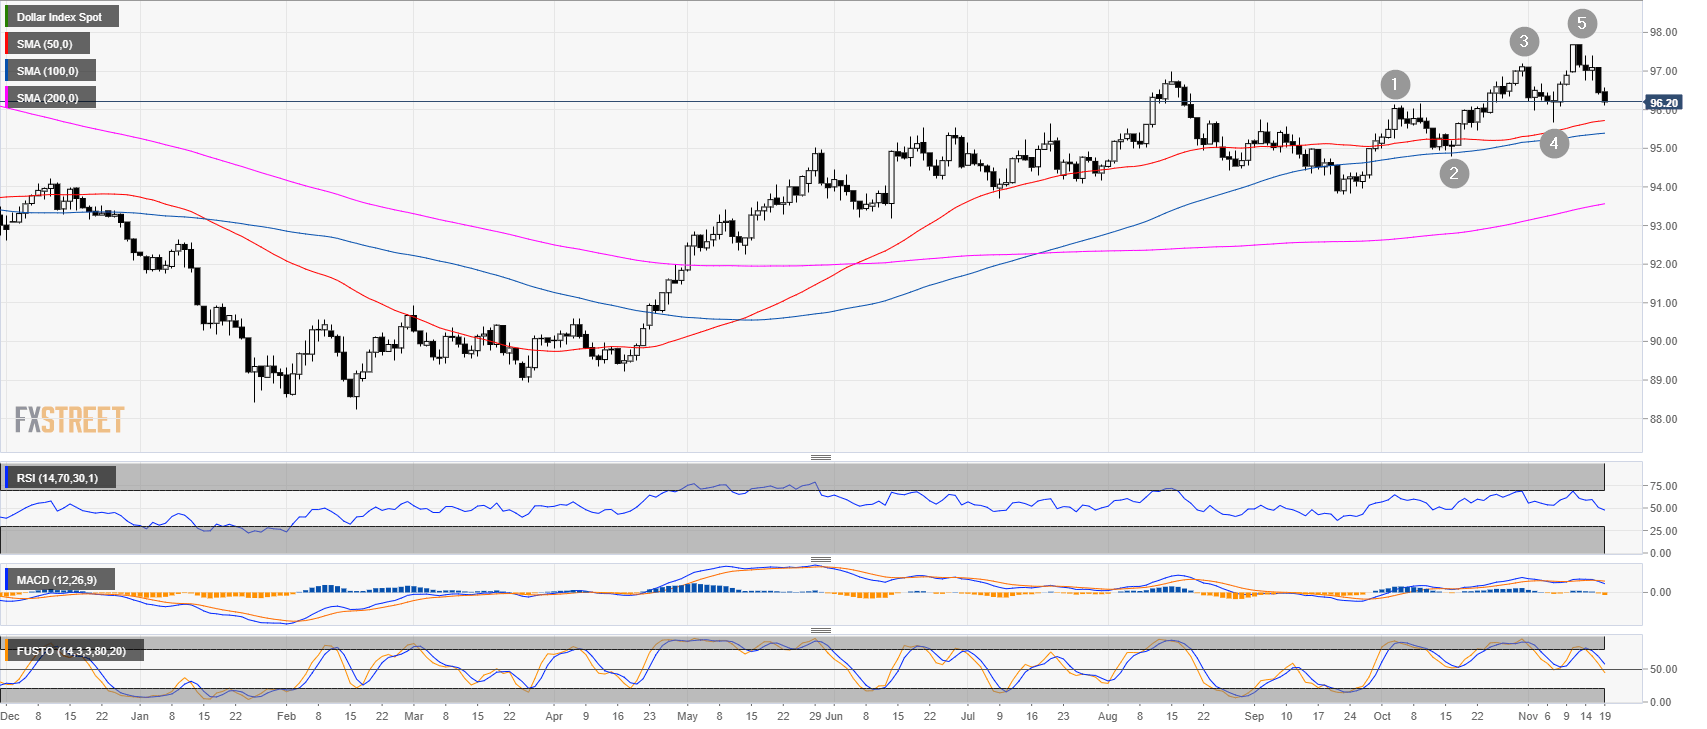
DXY daily chart
- The US Dollar Index (DXY) pulled back after the market formed a 5-wave Elliot pattern.
- Technical indicators turned bearish.
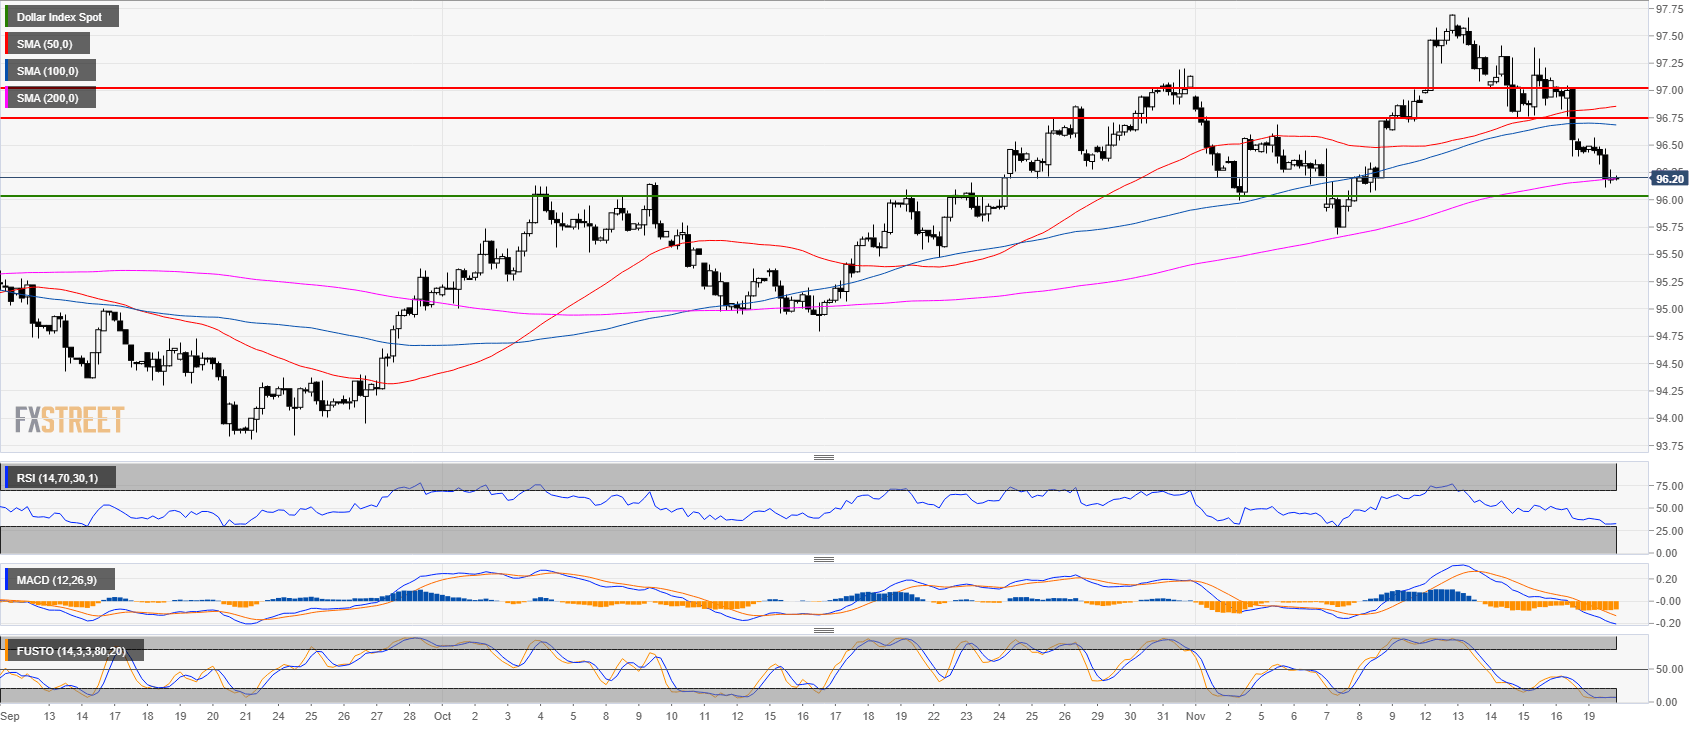
DXY 4-hour chart
- DXY broke below the 50 and 100-period simple moving averages (SMA) and is currently finding support at the 200 SMA just above the 96.00 figure.
- The Stochastic indicator is oversold suggesting that a pullback up can be in the making.
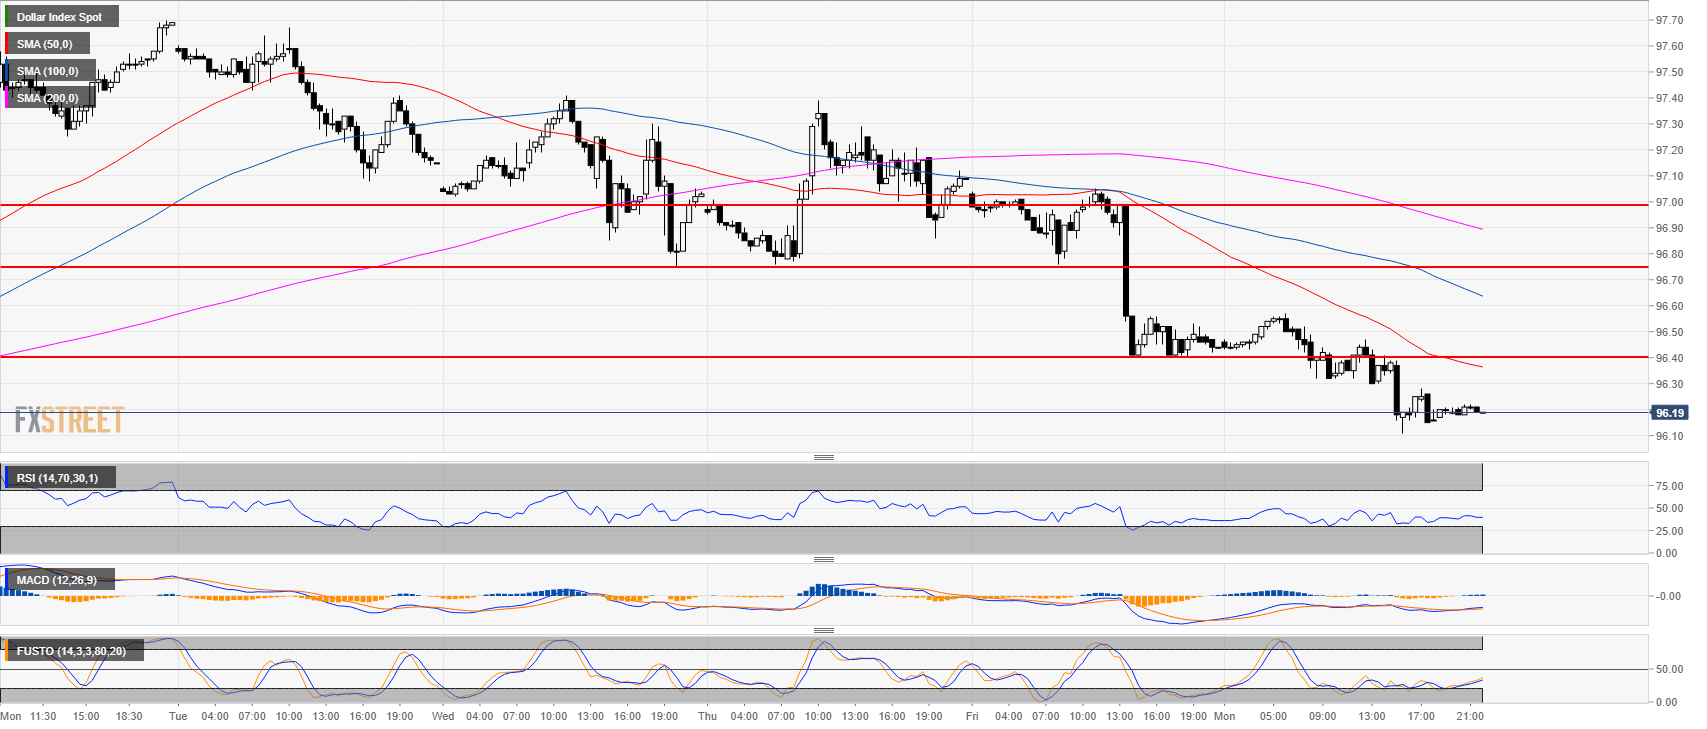
DXY 30-minute chart
- DXY is trading below its main simple moving averages so bulls will need to do a lot of work to bring the market back up.
- A quick spike down top 96.00 remains on the cards. But the downside remains limited.