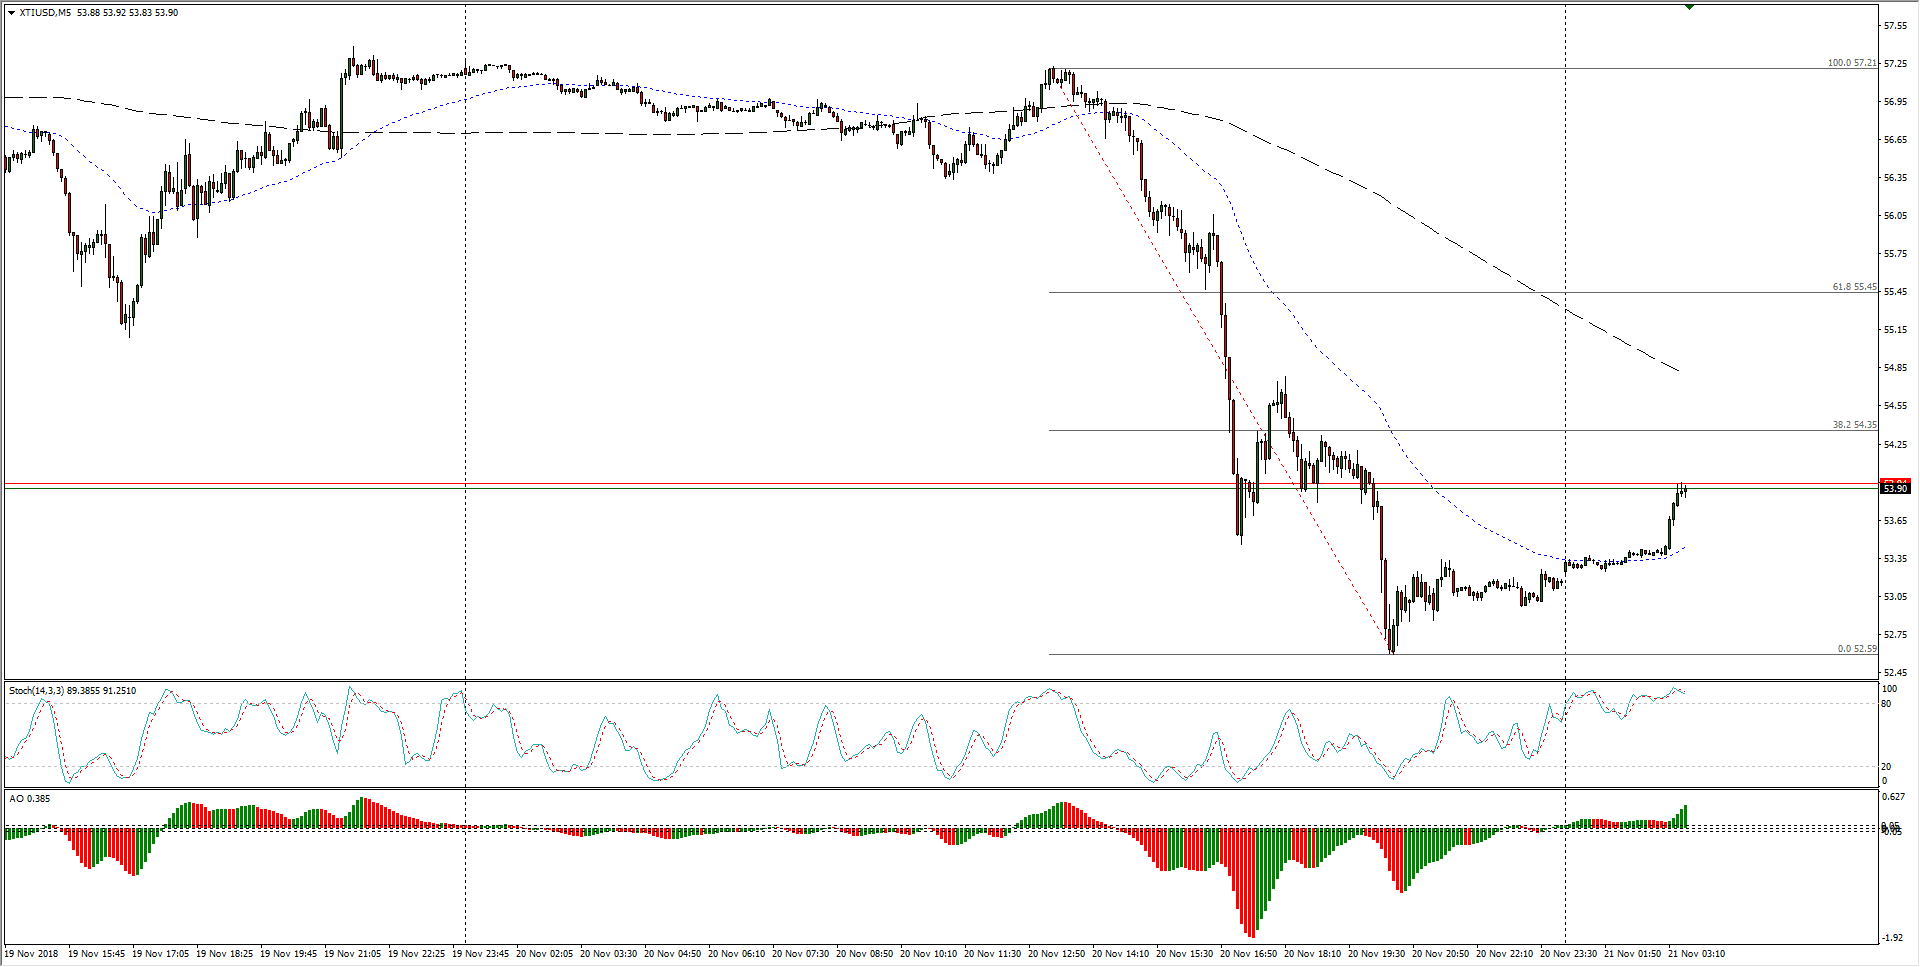
- The last twenty-four hours saw US crude oil prices slip into touching distance of 52.00, a critical low for WTI, and Wednesday’s early-session bounce from Tuesday’s bottoms is set to hit intraday resistance at the 38.2 Fibo retracement level at 54.35.
WTI Chart, 5-Minute
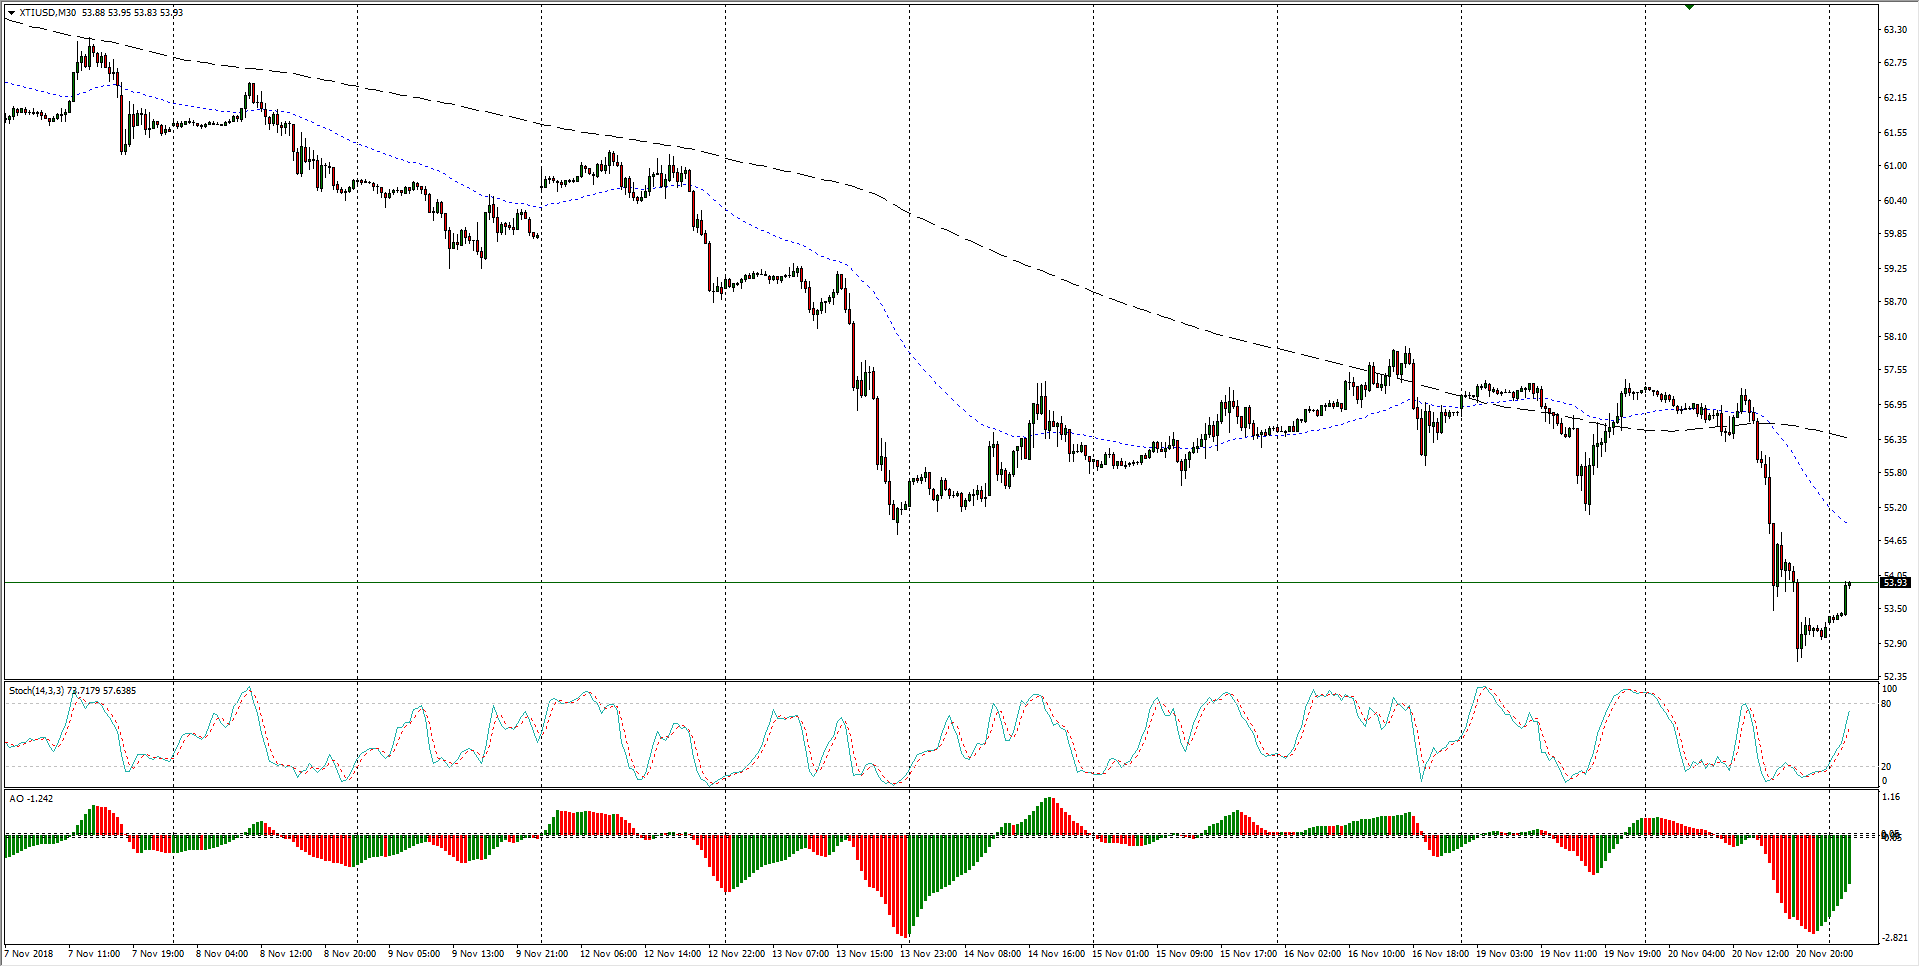
- The last two weeks have seen US crude prices fail to establish a bullish recovery from the last low set on November 13th at 54.75, and after several days of muted gains US crude barrels are back on the decline.
WTI Chart, 30-Minute
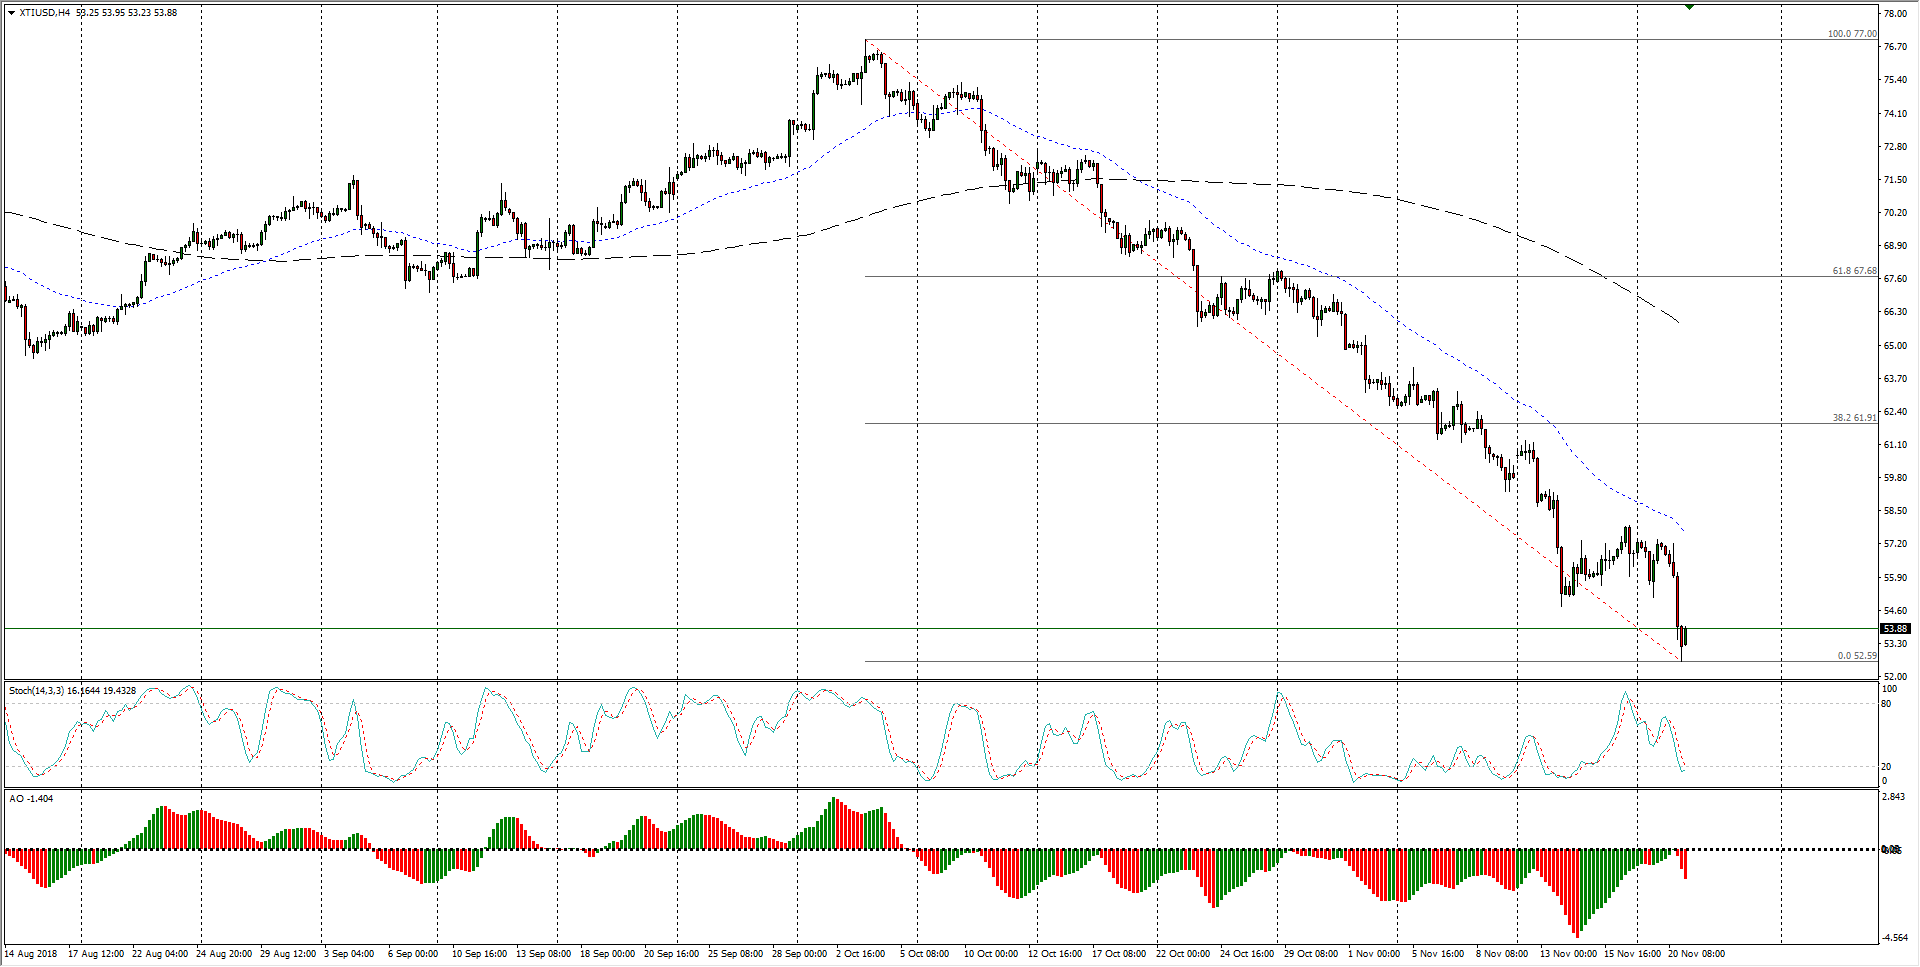
- WTI’s last quarter has seen a complete reversion into a bearish trend, and even a bounce into the 62.00 region would see US crude still stuck in a bearish chart stance after tumbling for what is now set to become a seven-week bear run.
WTI Chart, 4-Hour
WTI
Overview:
Last Price: 54.03
Daily change: 58 pips
Daily change: 1.09%
Daily Open: 53.45
Trends:
Daily SMA20: 60.35
Daily SMA50: 67.07
Daily SMA100: 67.75
Daily SMA200: 68.14
Levels:
Daily High: 53.52
Daily Low: 53.38
Weekly High: 60.93
Weekly Low: 55.21
Monthly High: 76.25
Monthly Low: 64.86
Daily Fibonacci 38.2%: 53.47
Daily Fibonacci 61.8%: 53.43
Daily Pivot Point S1: 53.38
Daily Pivot Point S2: 53.31
Daily Pivot Point S3: 53.24
Daily Pivot Point R1: 53.52
Daily Pivot Point R2: 53.59
Daily Pivot Point R3: 53.66
