- The past twnety-four hours sees the GBP/JPY catching some lift in early Wednesday as the Japanese Yen takes a mild step lower, allowing the Guppy to lift back into the 144.50 region.
GBP/JPY Chart, 5-Minute
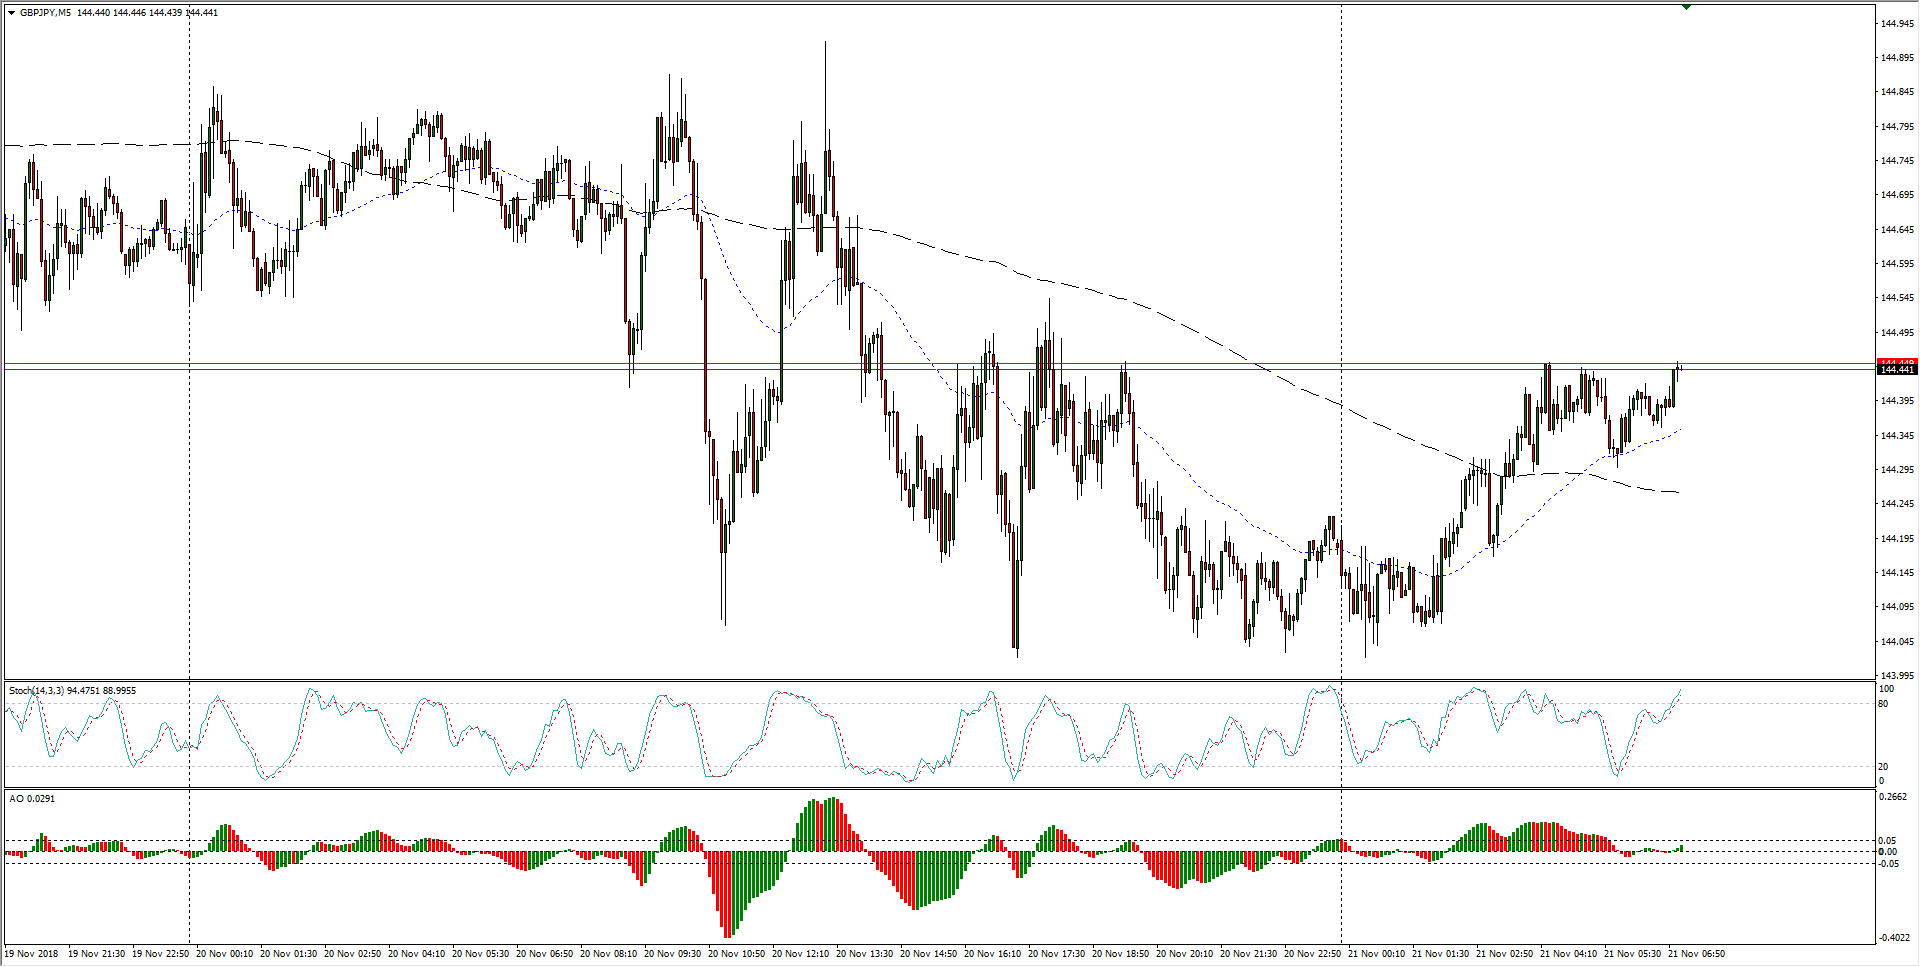
- The 144.50 level has proven to be a key support level for the Guppy, and if buyers fail to return the pair north of the critical technical barrier, it could sour into resistance in short order.
GBP/JPY Chart, 30-Minute
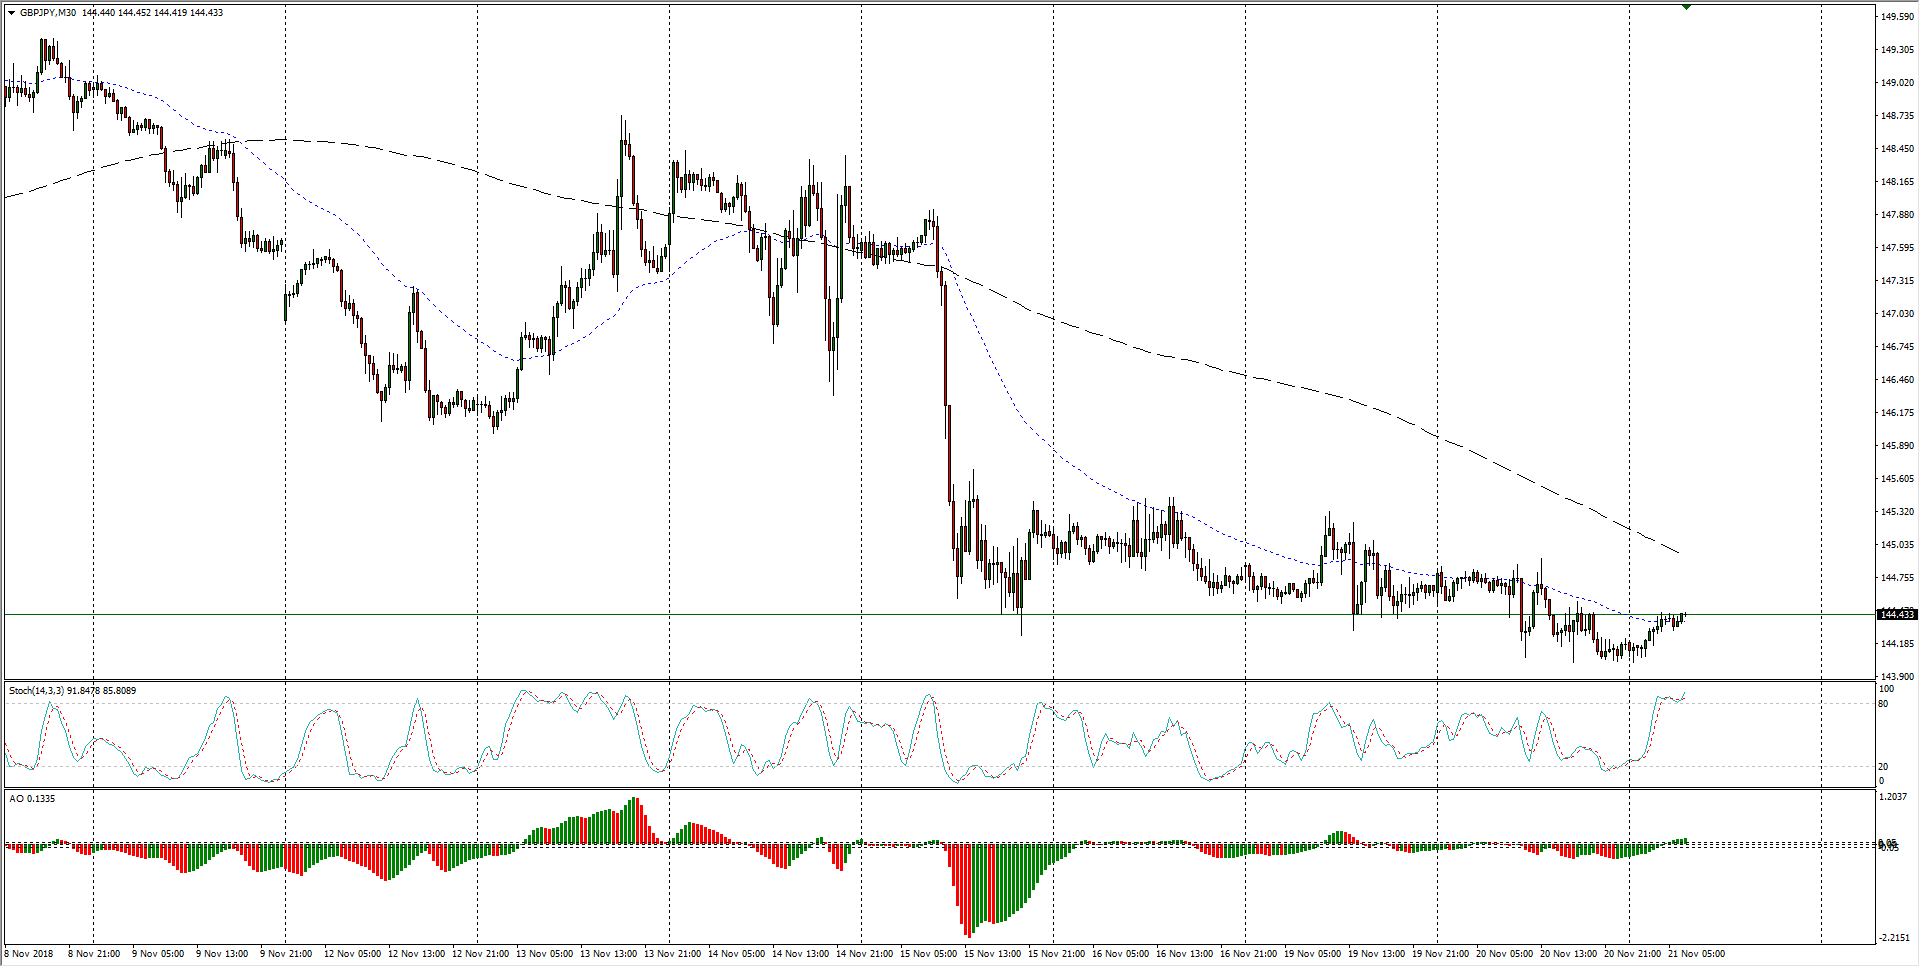
- The past quarter sees the Guppy cycling within a rough range between 143.50 and 149.00, and the current bearish decline could still fall a little bit further before turning over for the next bullish leg.
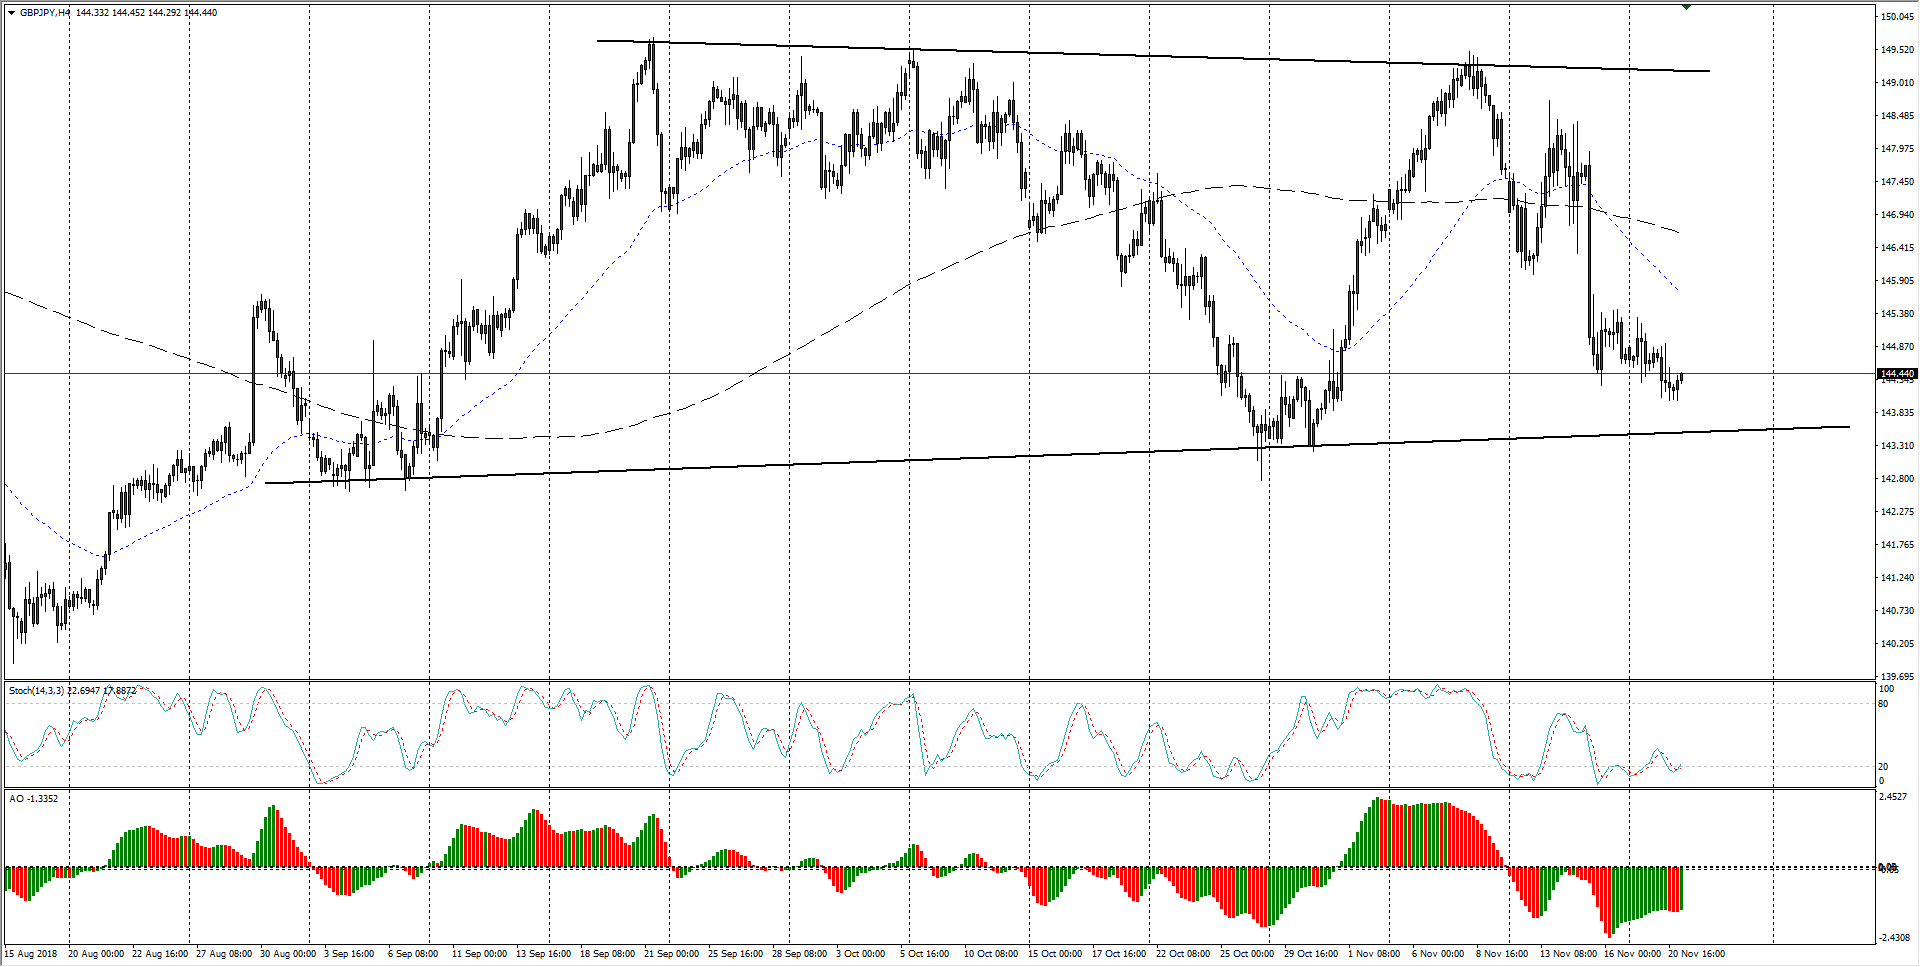
GBP/JPY Chart, 4-Hour
GBP/JPY
Overview:
Last Price: 144.45
Daily change: 36 pips
Daily change: 0.250%
Daily Open: 144.09
Trends:
Daily SMA20: 145.95
Daily SMA50: 146.98
Daily SMA100: 145.82
Daily SMA200: 147.14
Levels:
Daily High: 144.92
Daily Low: 144.01
Weekly High: 148.74
Weekly Low: 144.26
Monthly High: 149.52
Monthly Low: 142.78
Daily Fibonacci 38.2%: 144.36
Daily Fibonacci 61.8%: 144.58
Daily Pivot Point S1: 143.76
Daily Pivot Point S2: 143.43
Daily Pivot Point S3: 142.85
Daily Pivot Point R1: 144.67
Daily Pivot Point R2: 145.25
Daily Pivot Point R3: 145.58
