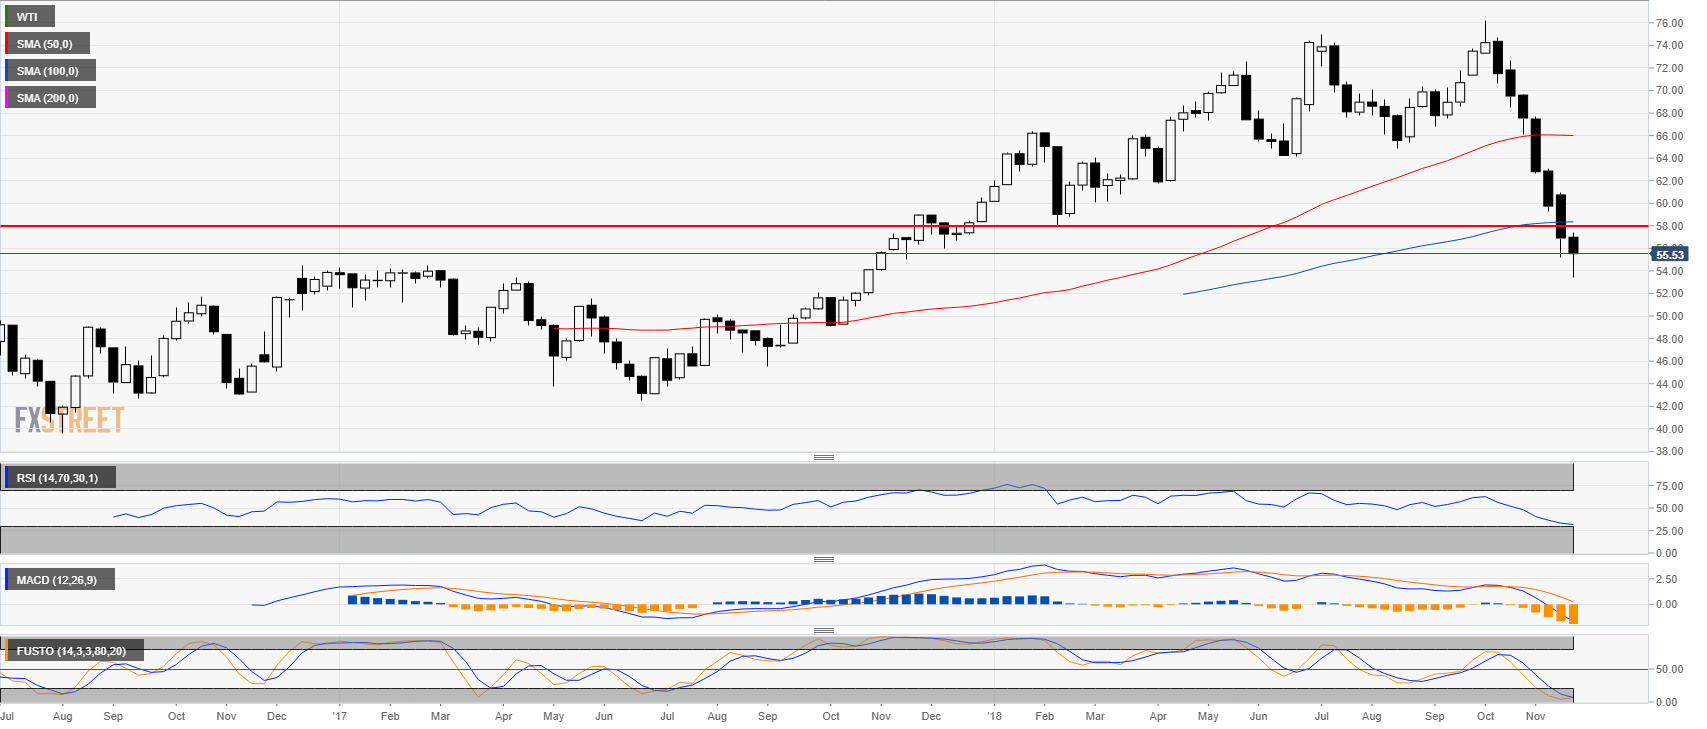
Crude oil weekly chart
- Crude oil is in a steep bear trend as it erased the yearly gains.
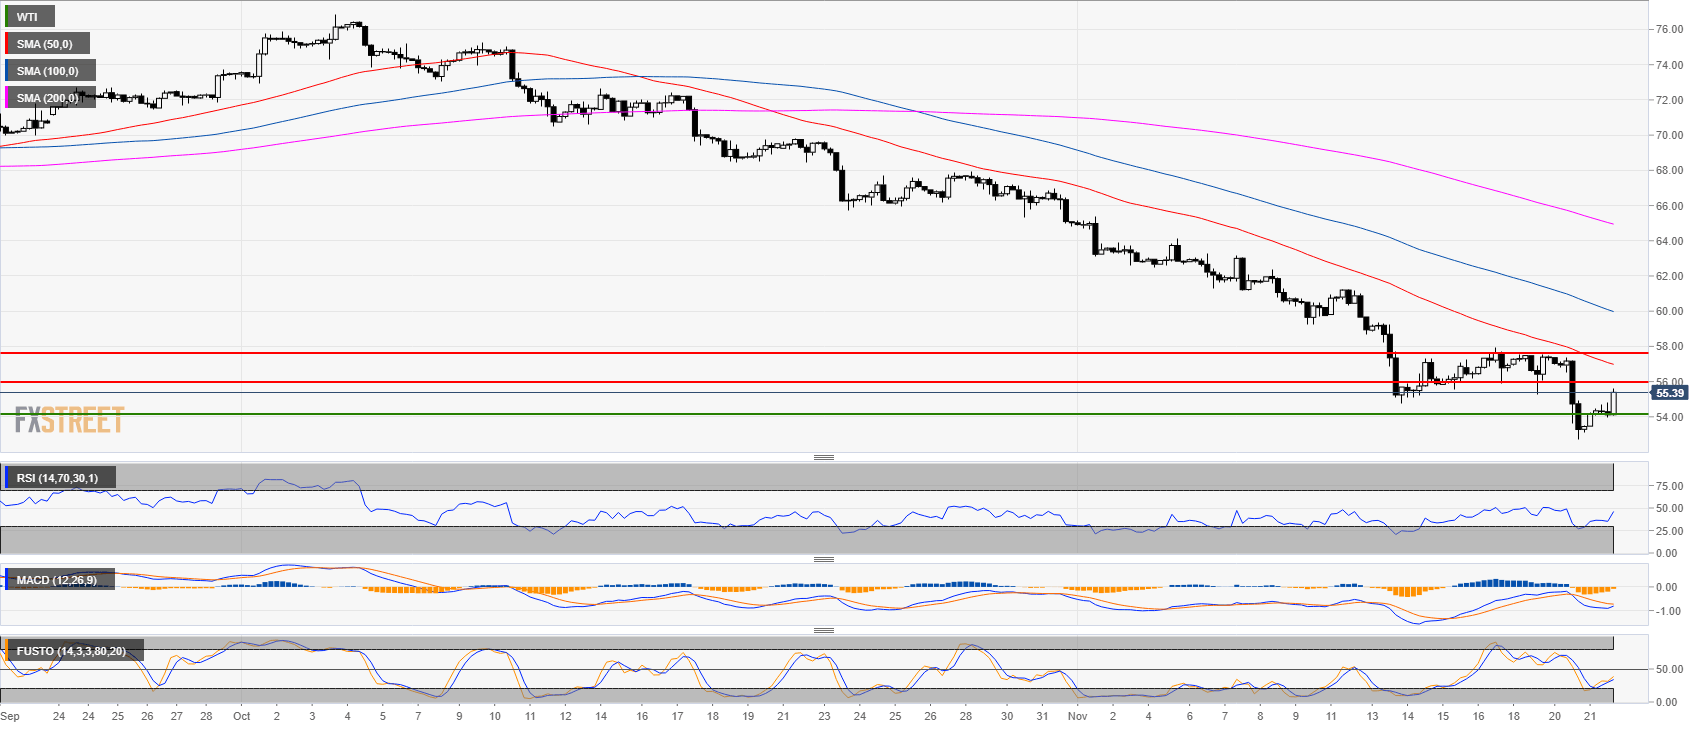
Crude oil 4-hour chart
- Oil is strongly rebounding from the yearly low.
- The next key resistance to overcome is $56.00 a barrel on WTI.
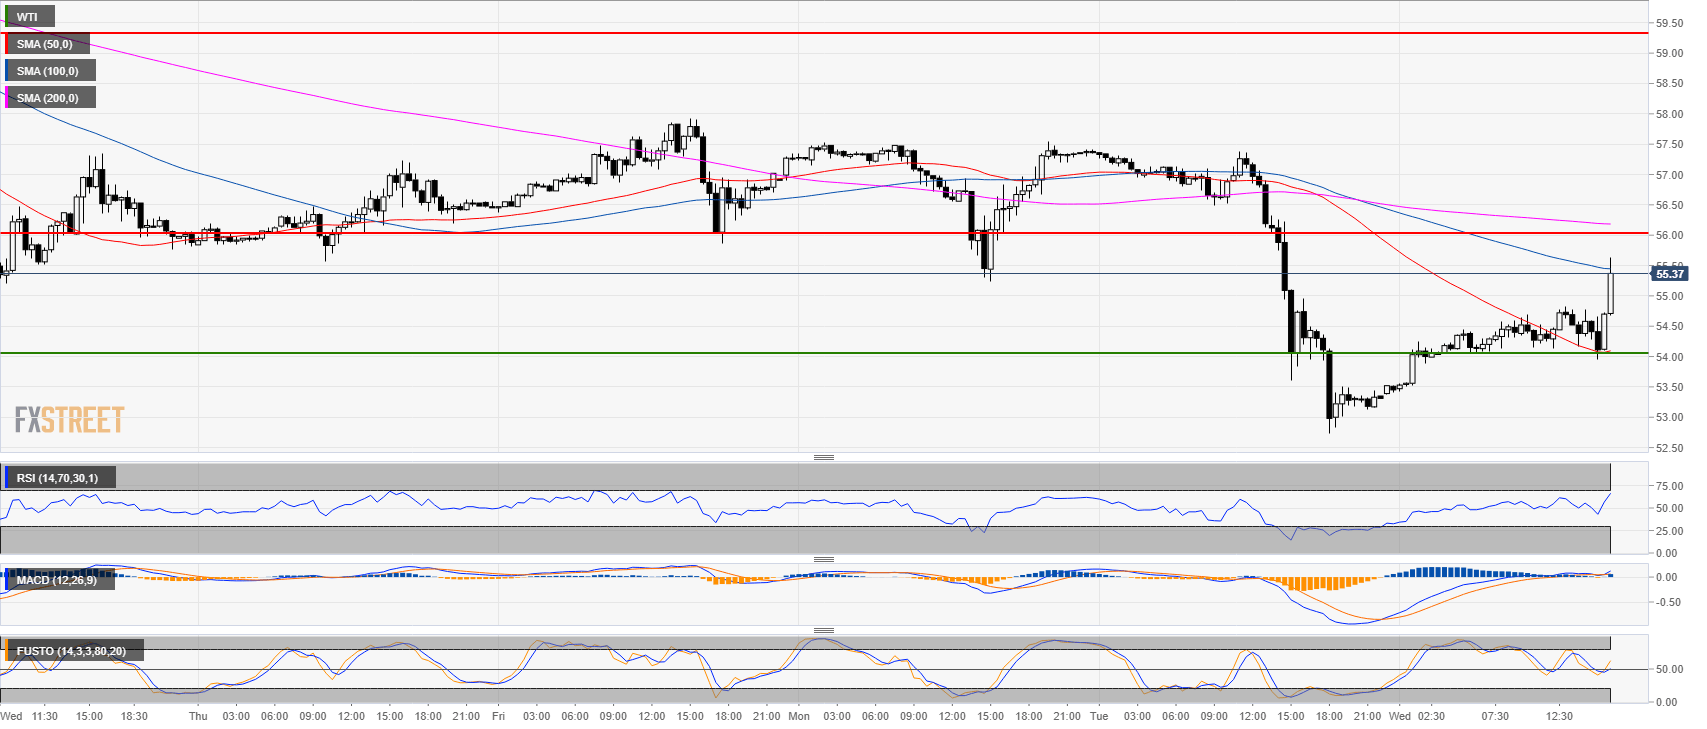
Crude oil 30-minute chart
- Bulls regained the 50 SMA and are now testing the 100 SMA.
- 54.00 is the new short-term support.
- 56.00 is the target for bulls.
Additional ley levels at a glance:
WTI
Overview:
Last Price: 55.44
Daily change: 2.0e+2 pips
Daily change: 3.72%
Daily Open: 53.45
Trends:
Daily SMA20: 60.35
Daily SMA50: 67.07
Daily SMA100: 67.75
Daily SMA200: 68.14
Levels:
Daily High: 53.52
Daily Low: 53.38
Weekly High: 60.93
Weekly Low: 55.21
Monthly High: 76.25
Monthly Low: 64.86
Daily Fibonacci 38.2%: 53.47
Daily Fibonacci 61.8%: 53.43
Daily Pivot Point S1: 53.38
Daily Pivot Point S2: 53.31
Daily Pivot Point S3: 53.24
Daily Pivot Point R1: 53.52
Daily Pivot Point R2: 53.59
Daily Pivot Point R3: 53.66
