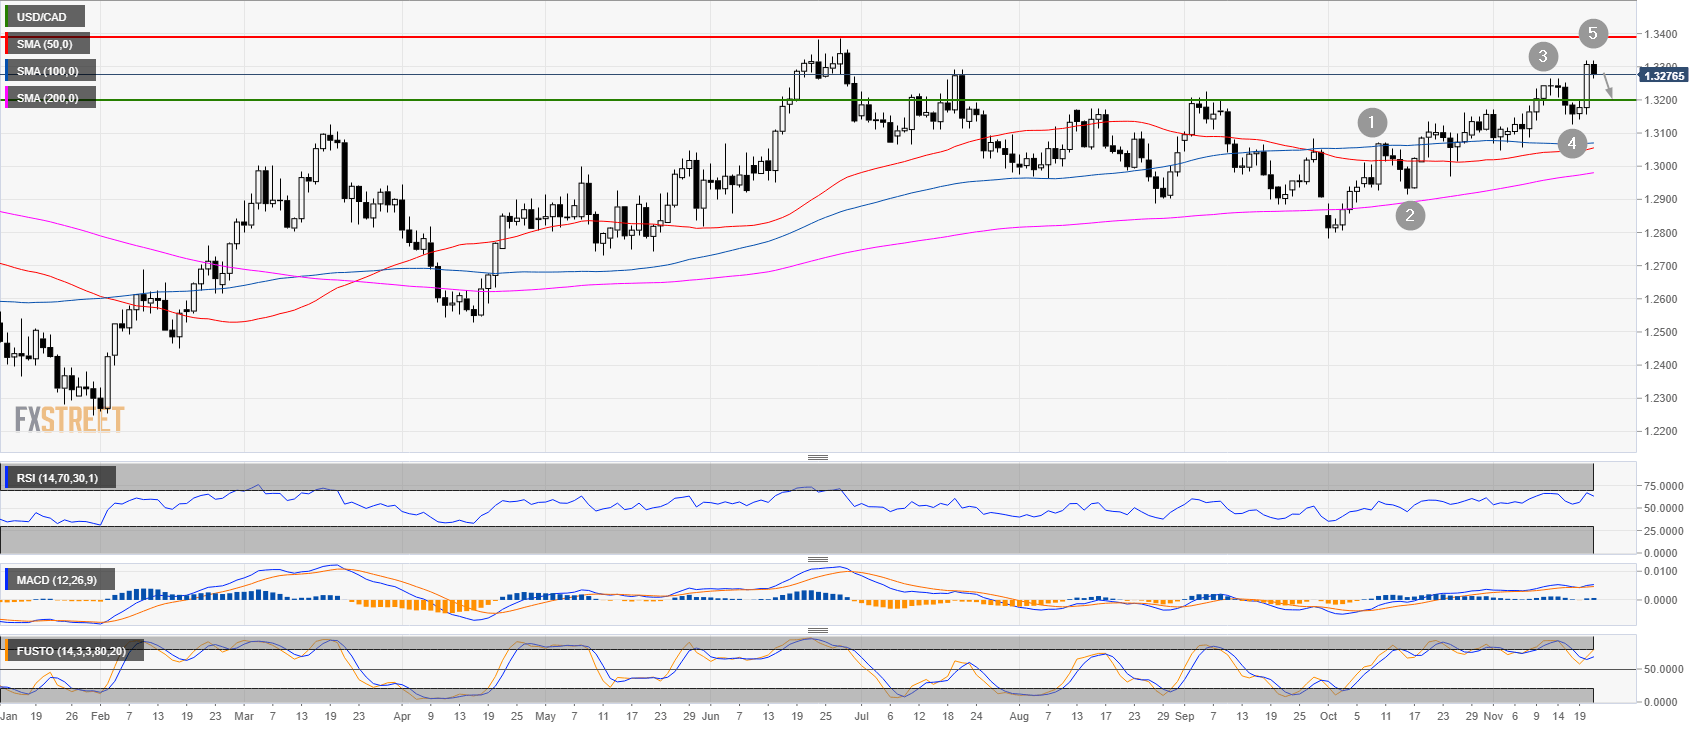
USD/CAD daily chart
- USD/CAD is trading in a bull trend above the 200-day simple moving average.
- USD/CAD printed a 5-wave Elliot pattern which can potentially USD.CAD down to 1.3200 figure.
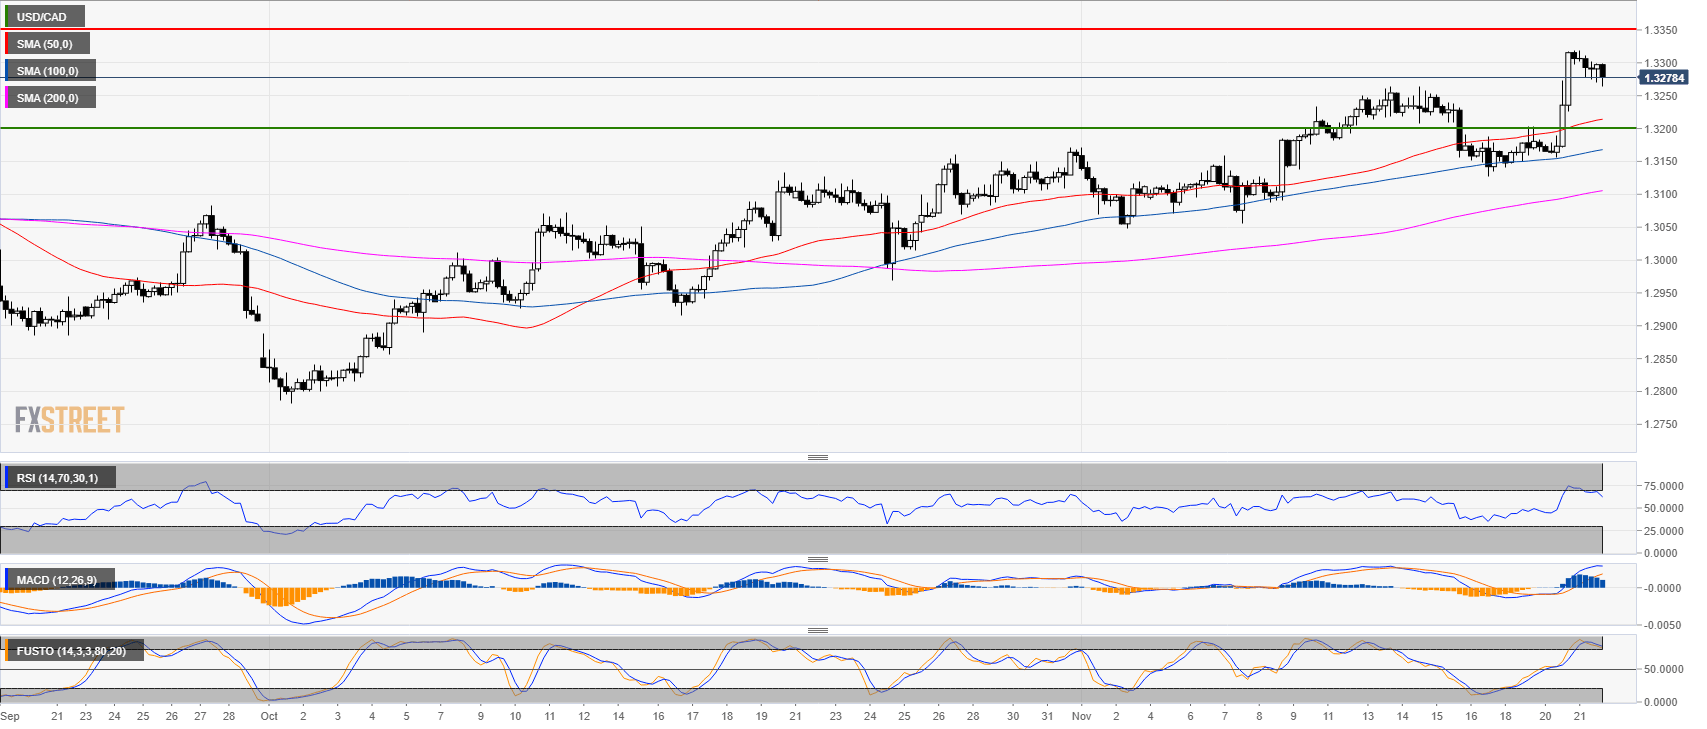
USD/CAD 4-hour chart
- Technical indicators are losing bullishness suggesting a deeper pullback.
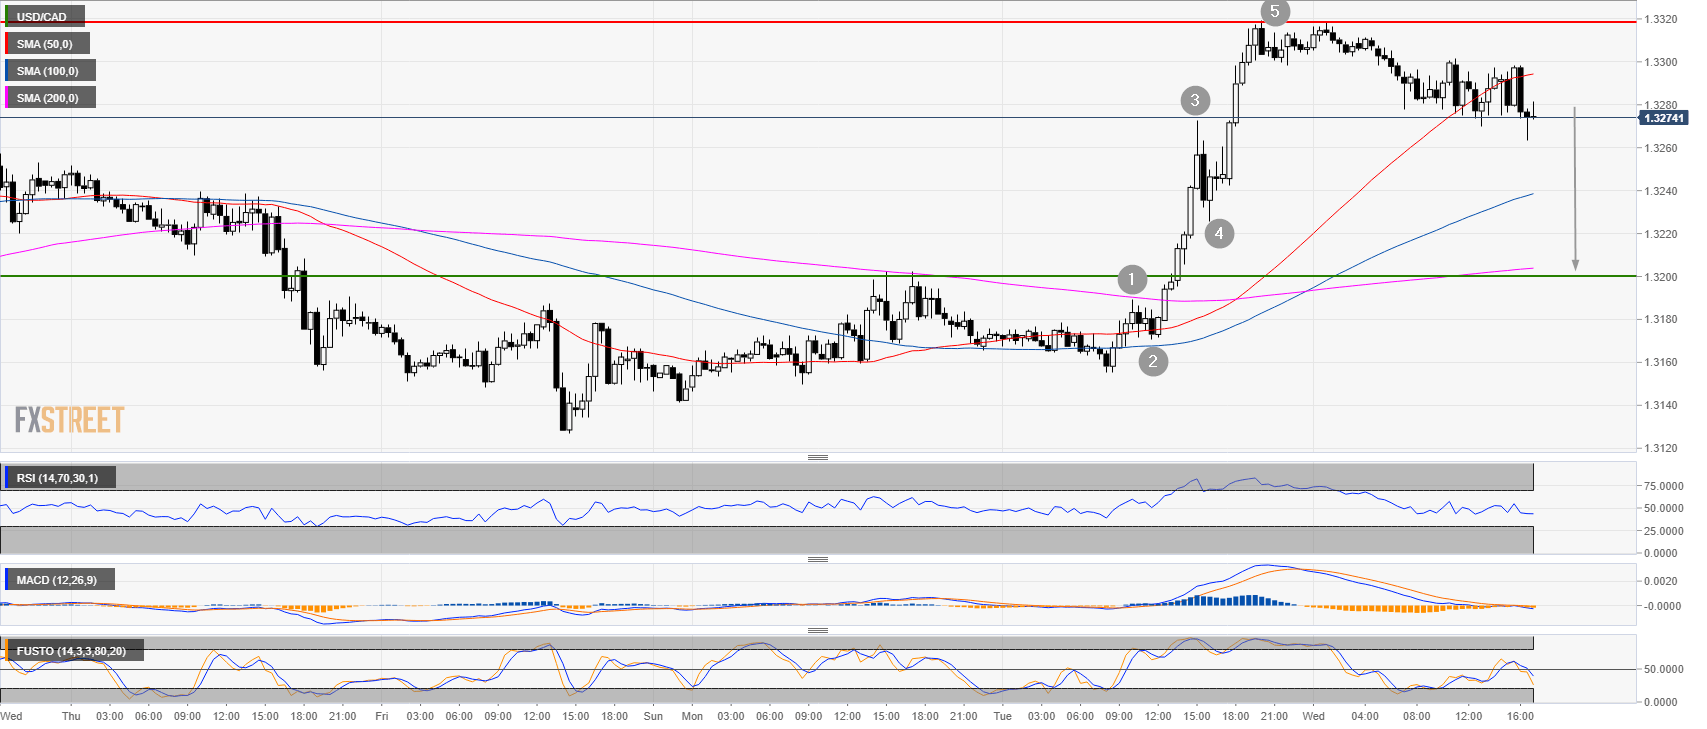
USD/CAD 30-minute chart
- The level to beat for bull is 1.3320 resistance.
- Bears broke below the 50 SMA as indicators are decelerating.
- USD/CAD formed also fomed a 5-wave pattern on the 30-minute chart.
Additional key levels at a glance:
