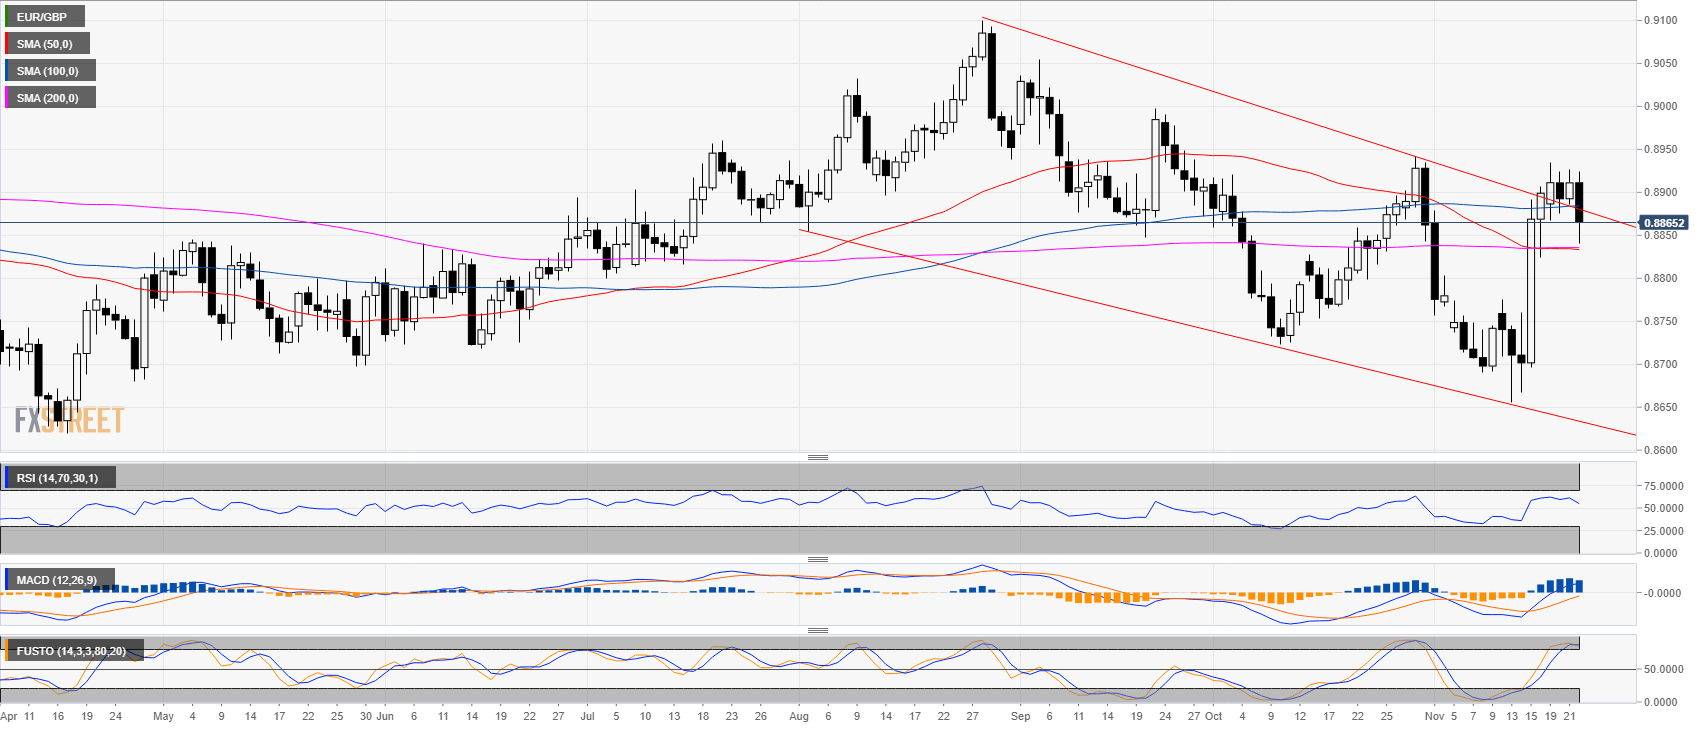
EUR/GBP daily chart
- EUR/GBP is trading above its 50 and 200-day simple moving averages (SMA).
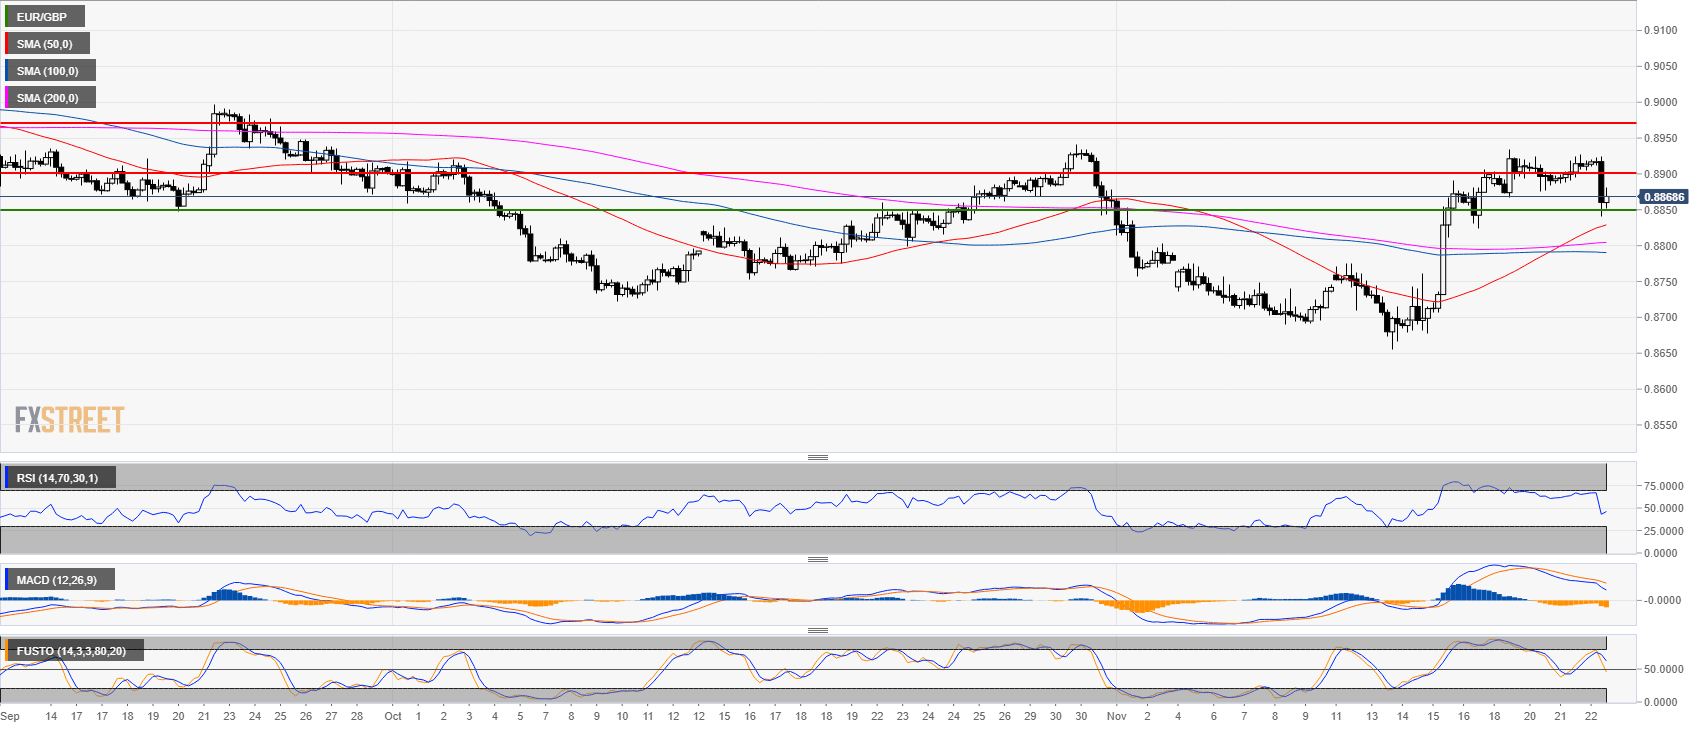
EUR/GBP 4-hour chart
- EUR/GBP found support at the 0.8850 level.
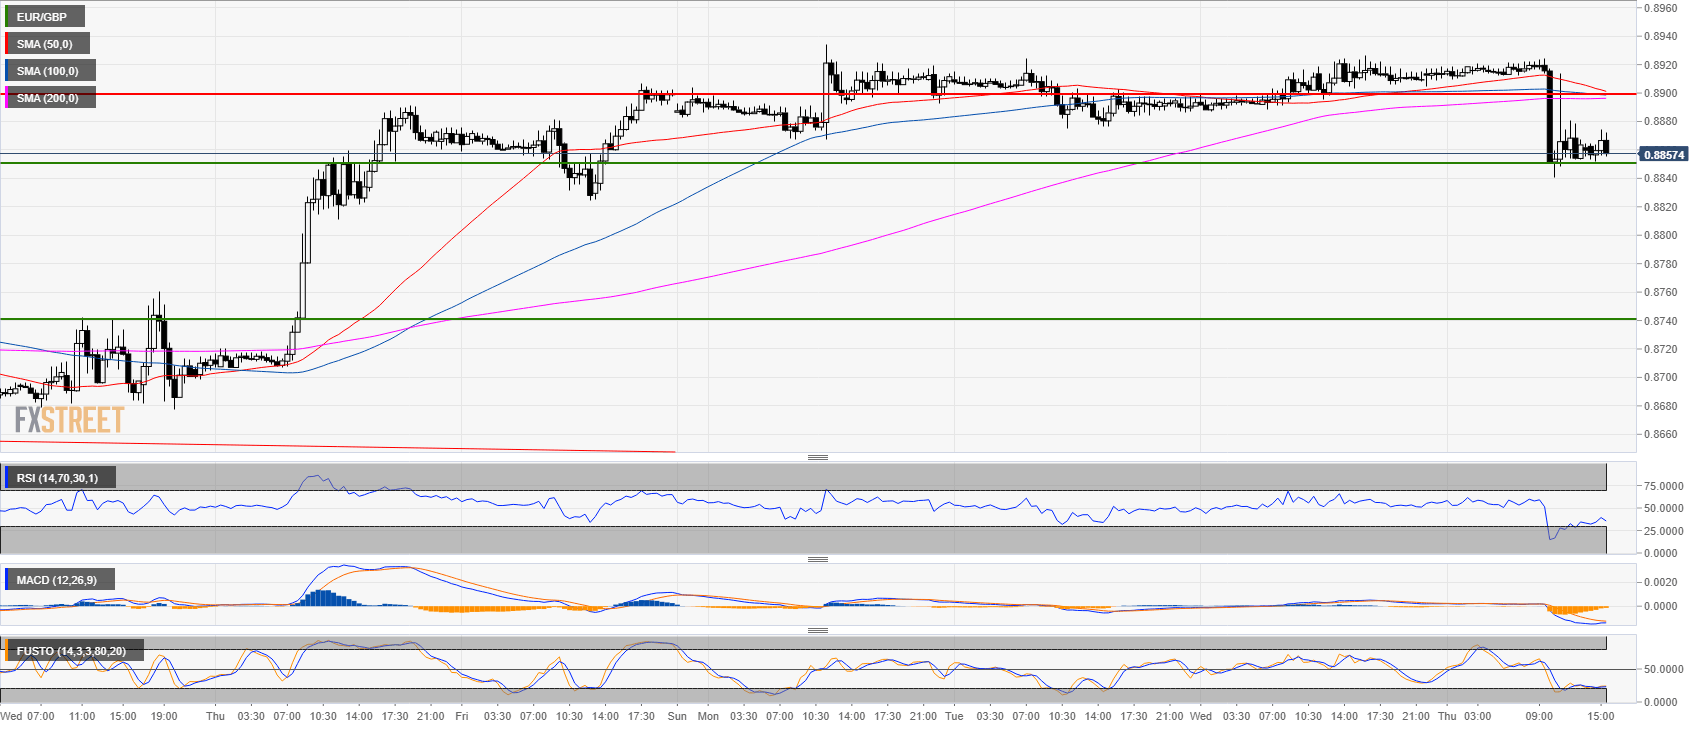
EUR/GBP 30-minute chart
- EUR/GBP sold off on Brexit-related news.
- The market is recovering with technical indicators slowly picking up.
- The target for bulls is seen at 0.8900 figure.
Additional key levels:
EUR/GBP
Overview:
Last Price: 0.8867
Daily change: -44 pips
Daily change: -0.494%
Daily Open: 0.8911
Trends:
Daily SMA20: 0.8812
Daily SMA50: 0.8834
Daily SMA100: 0.8884
Daily SMA200: 0.8836
Levels:
Daily High: 0.8926
Daily Low: 0.8886
Weekly High: 0.8906
Weekly Low: 0.8656
Monthly High: 0.8942
Monthly Low: 0.8722
Daily Fibonacci 38.2%: 0.8911
Daily Fibonacci 61.8%: 0.8902
Daily Pivot Point S1: 0.8889
Daily Pivot Point S2: 0.8868
Daily Pivot Point S3: 0.8849
Daily Pivot Point R1: 0.893
Daily Pivot Point R2: 0.8948
Daily Pivot Point R3: 0.897
