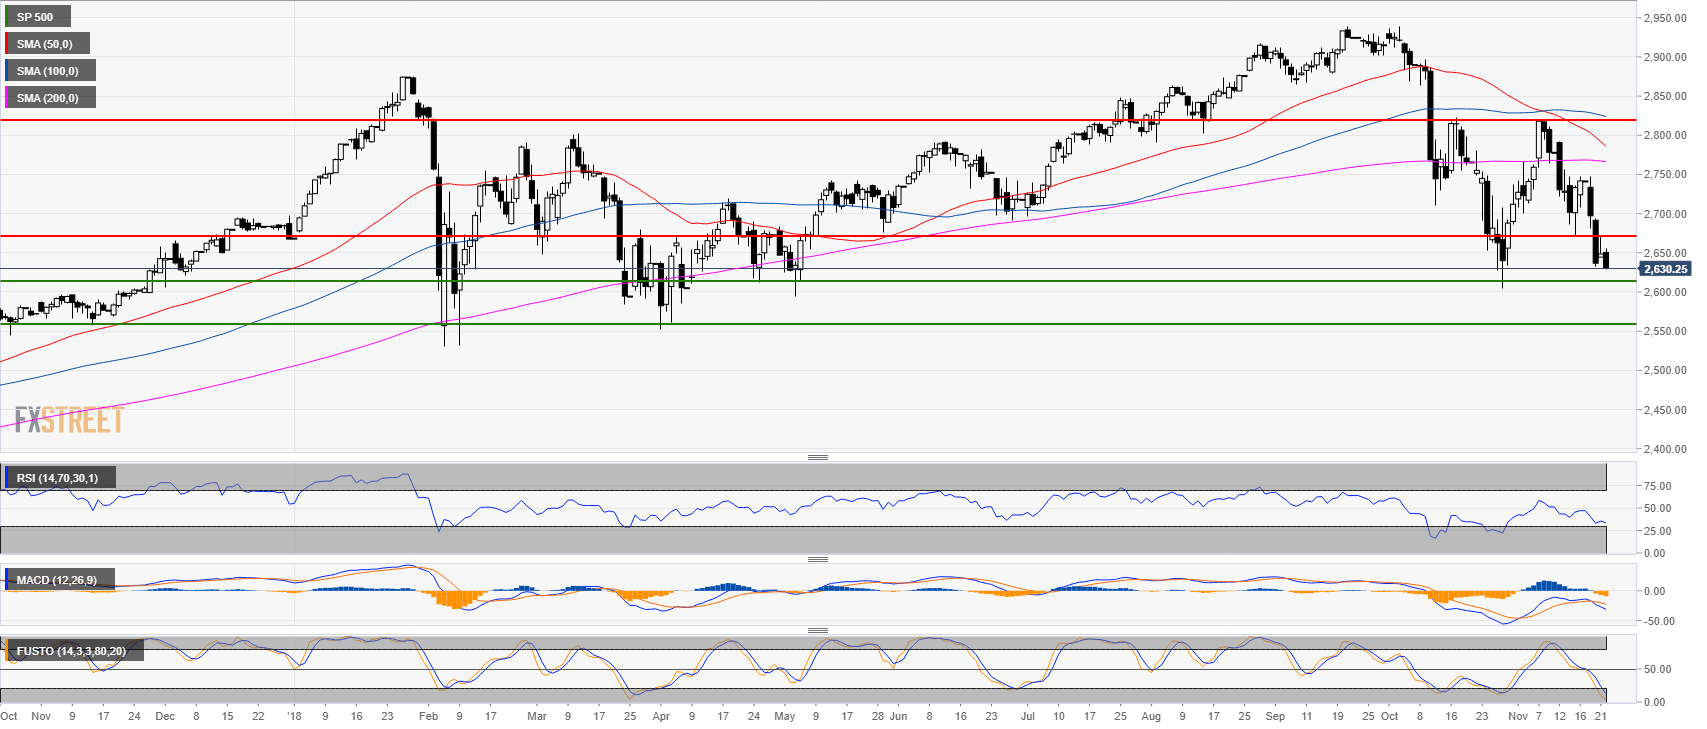
S&P500 daily chart
- The S&P500 is trading in a bear trend below the 200-day simple moving average (SMA).
- Supports are seen near the 2,620.00 and 2,560.00 level.
- Technical indicators are in bearish territories suggesting further weakness ahead.
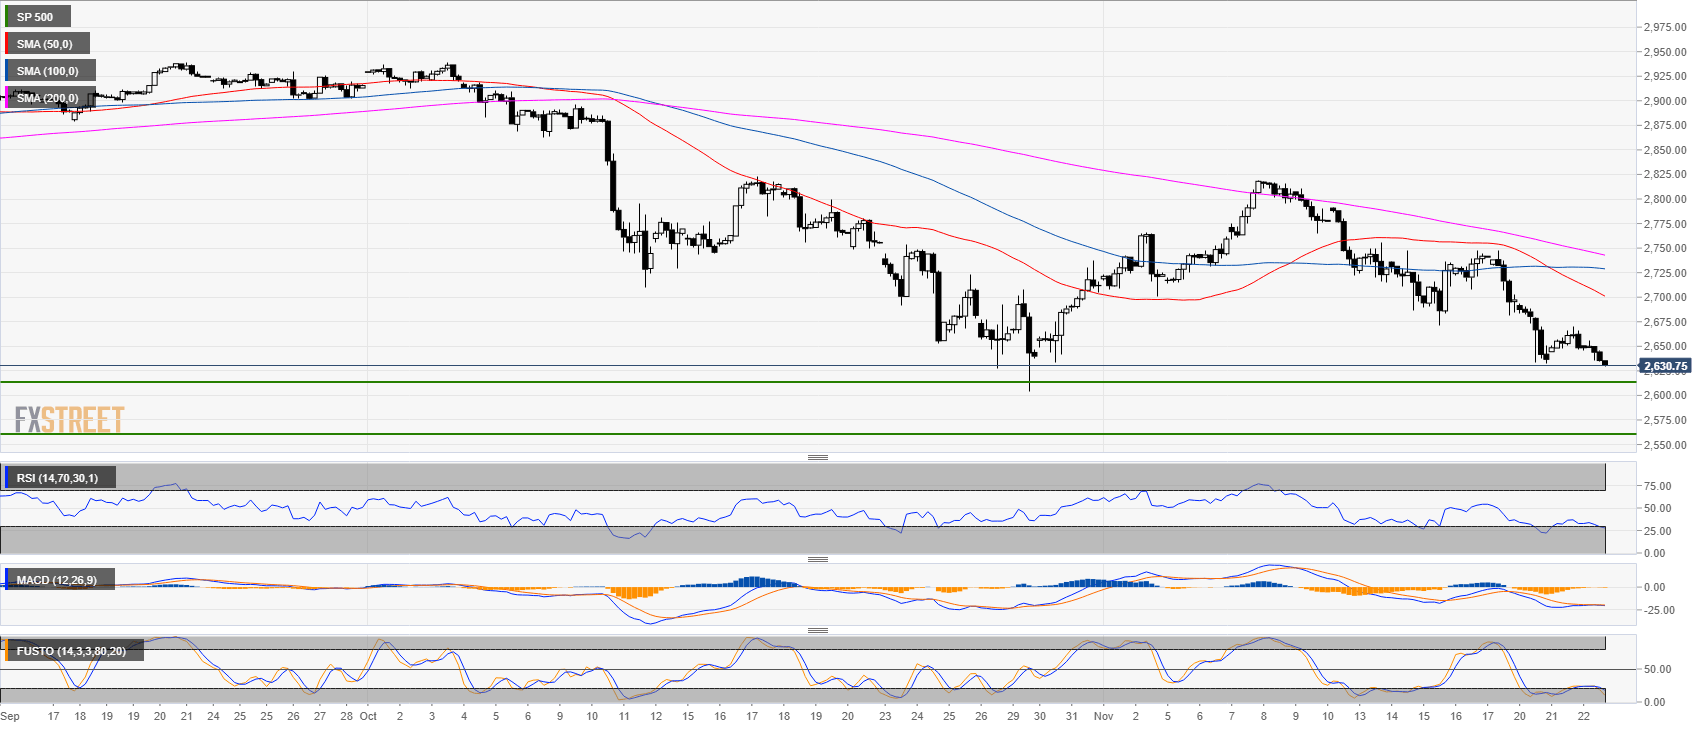
S&P500 4-hour chart
- The S&P500 is trading below its main SMAs.
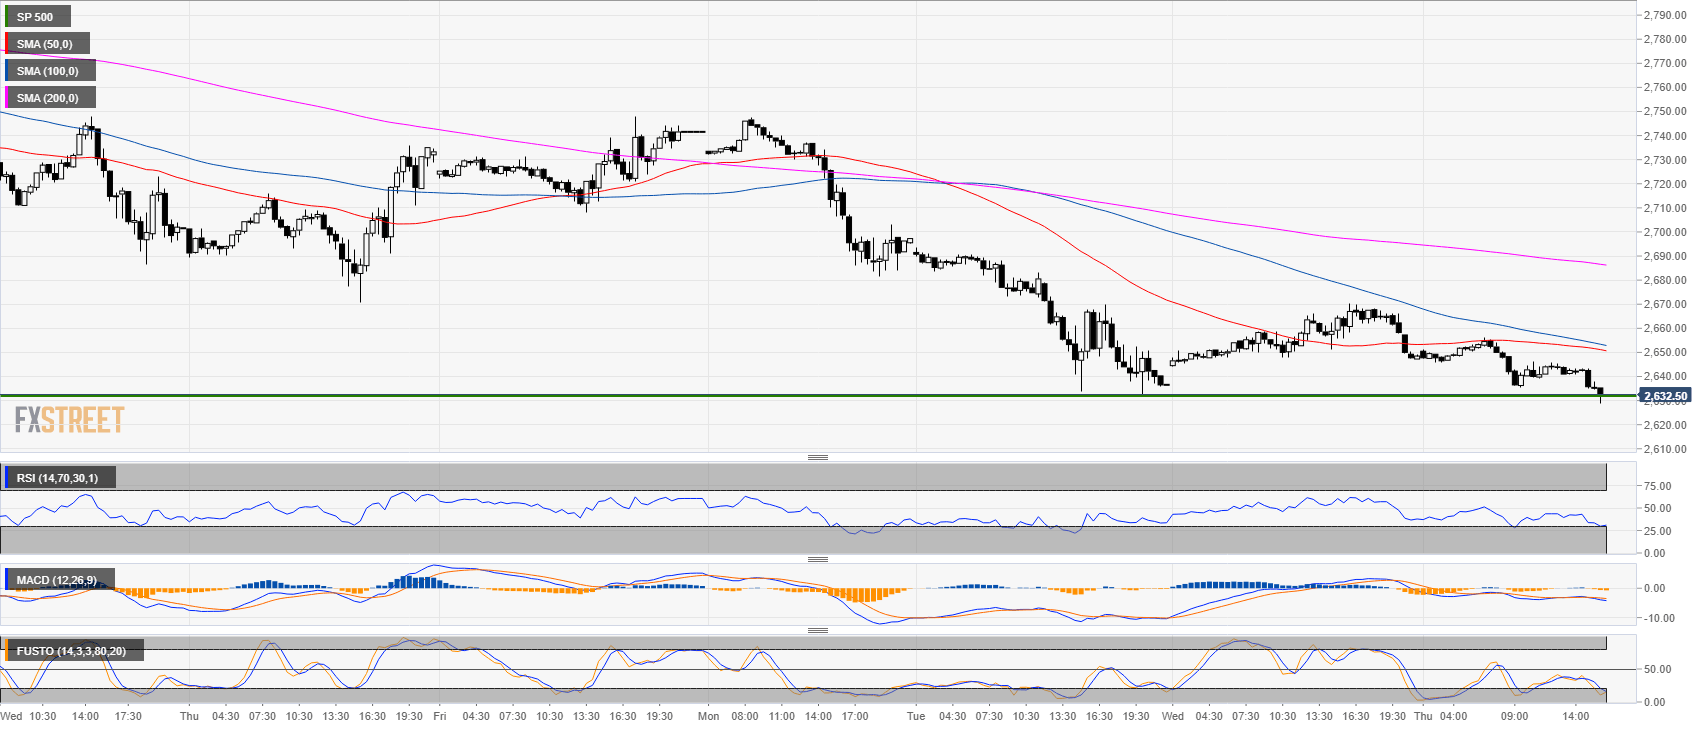
S&P500 30-minute chart
- Bears are currently challenging Tuesday’s low.
- Technical indicators are bearish.
Additional key levels:
SP 500
Overview:
Last Price: 2632
Daily change: -1.7e+3 pips
Daily change: -0.623%
Daily Open: 2648.5
Trends:
Daily SMA20: 2726.51
Daily SMA50: 2791.84
Daily SMA100: 2825.71
Daily SMA200: 2767.14
Levels:
Daily High: 2670.5
Daily Low: 2644.25
Weekly High: 2791.75
Weekly Low: 2670.75
Monthly High: 2939.5
Monthly Low: 2604.5
Daily Fibonacci 38.2%: 2660.47
Daily Fibonacci 61.8%: 2654.28
Daily Pivot Point S1: 2638.33
Daily Pivot Point S2: 2628.17
Daily Pivot Point S3: 2612.08
Daily Pivot Point R1: 2664.58
Daily Pivot Point R2: 2680.67
Daily Pivot Point R3: 2690.83
