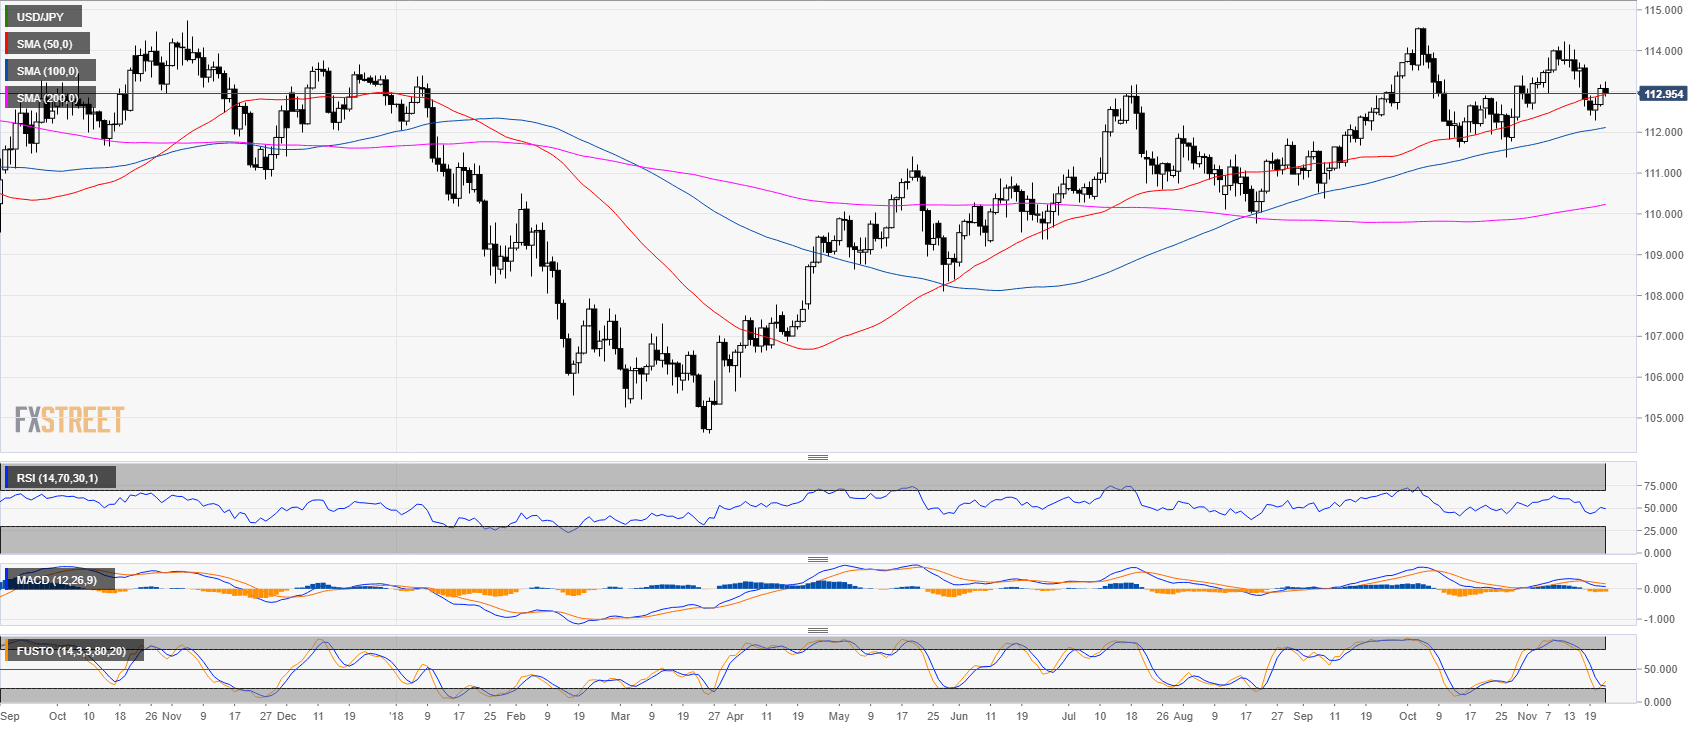
USD/JPY daily chart
- USD/JPY is trading just above the 50-day simple moving average (SMA).
- The RSI indicator is near the 50 line while the MACD and Stochastic are bearish.
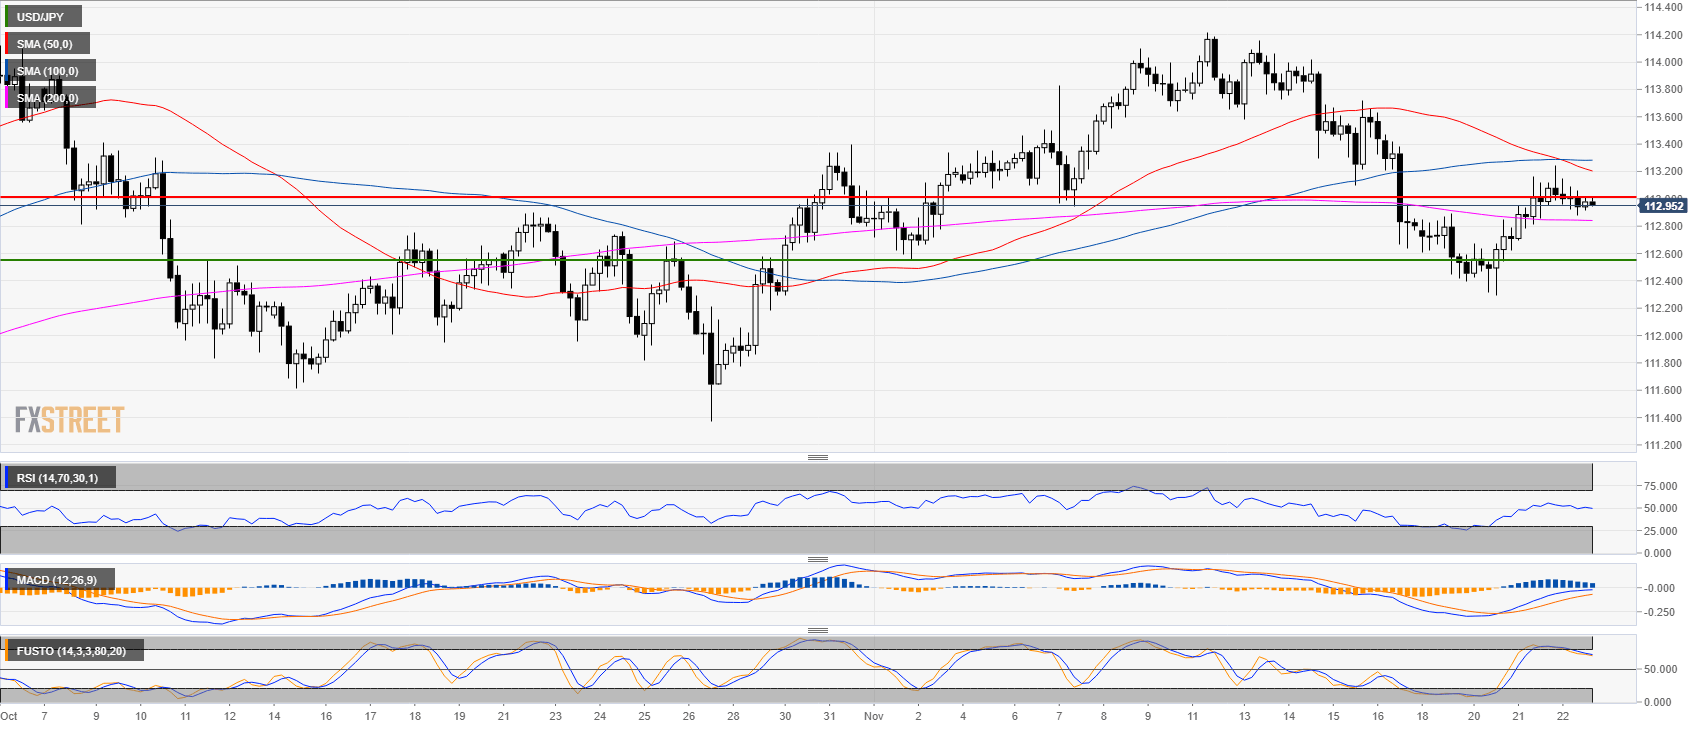
USD/JPY 4-hour chart
- USD/JPY is trapped between the 200 SMA and the 113.00 figure.
- Technical indicators are in positive territories.
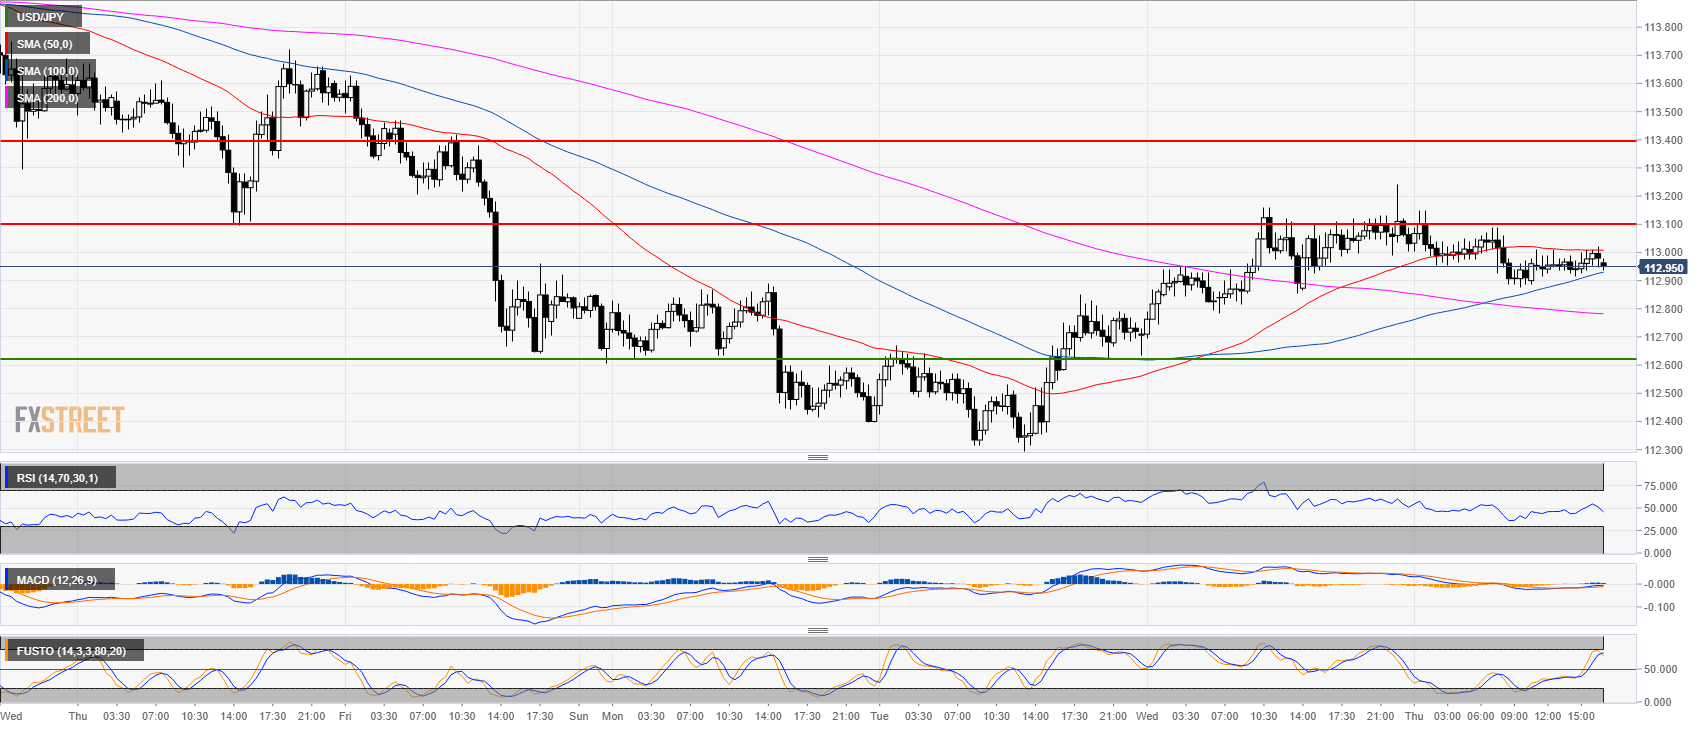
USD/JPY 30-minute chart
- USD/JPY is supported by the 100 SMA.
- Technical indicators are picking up steam suggesting a mild bullish bias overall.
- Resistances are seen at the 113.00 and 113.40 levels.
Additional key levels
USD/JPY
Overview:
Last Price: 112.98
Daily change: -9.0 pips
Daily change: -0.0796%
Daily Open: 113.07
Trends:
Daily SMA20: 113.12
Daily SMA50: 112.9
Daily SMA100: 112.09
Daily SMA200: 110.2
Levels:
Daily High: 113.16
Daily Low: 112.64
Weekly High: 114.22
Weekly Low: 112.64
Monthly High: 114.56
Monthly Low: 111.38
Daily Fibonacci 38.2%: 112.96
Daily Fibonacci 61.8%: 112.84
Daily Pivot Point S1: 112.75
Daily Pivot Point S2: 112.43
Daily Pivot Point S3: 112.23
Daily Pivot Point R1: 113.28
Daily Pivot Point R2: 113.48
Daily Pivot Point R3: 113.8
