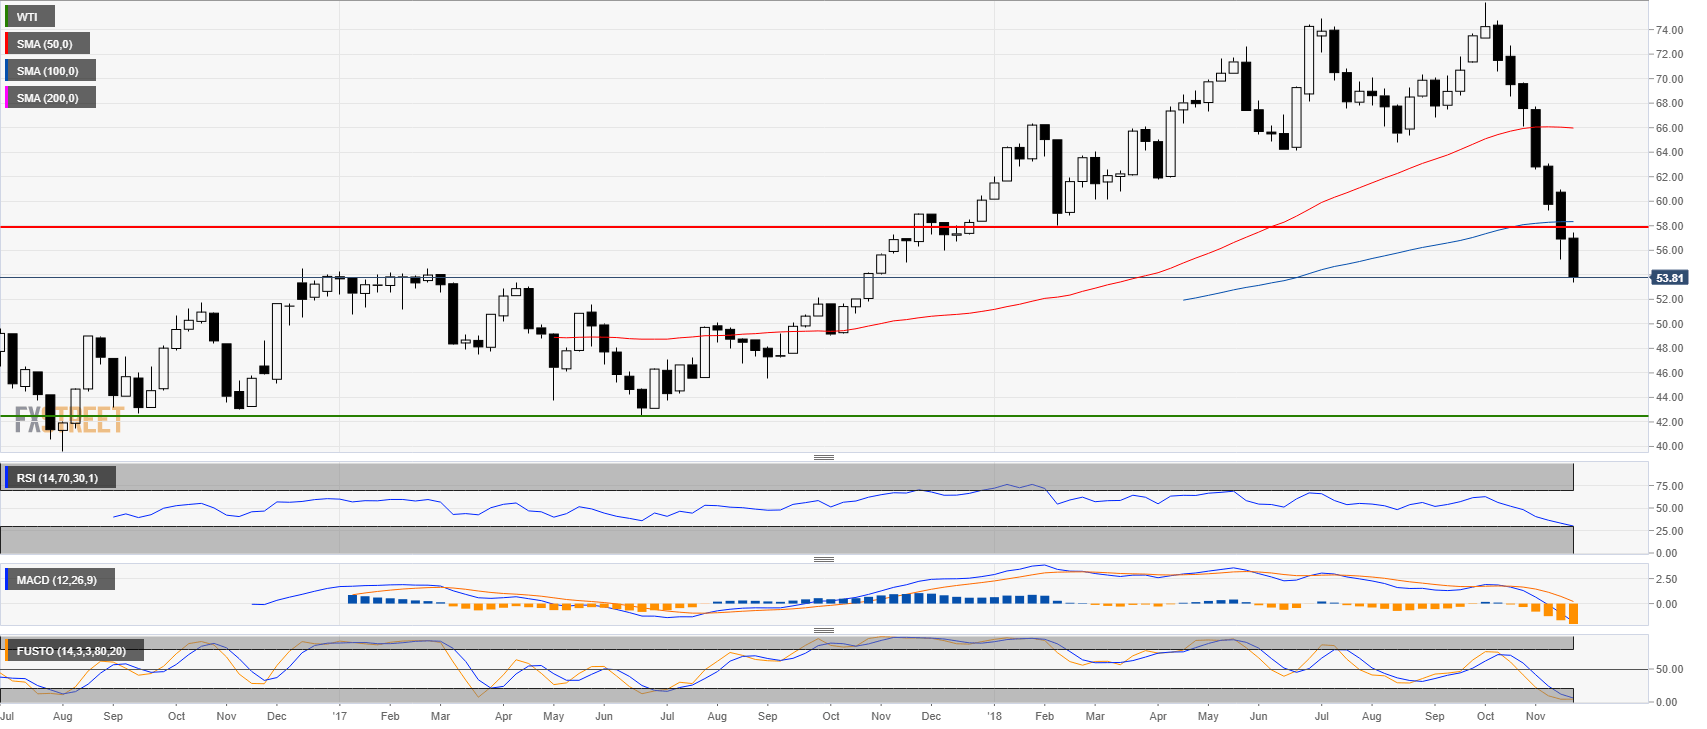
Crude oil weekly chart
- Crude oil is in a steep bear trend as it erased the yearly gains.
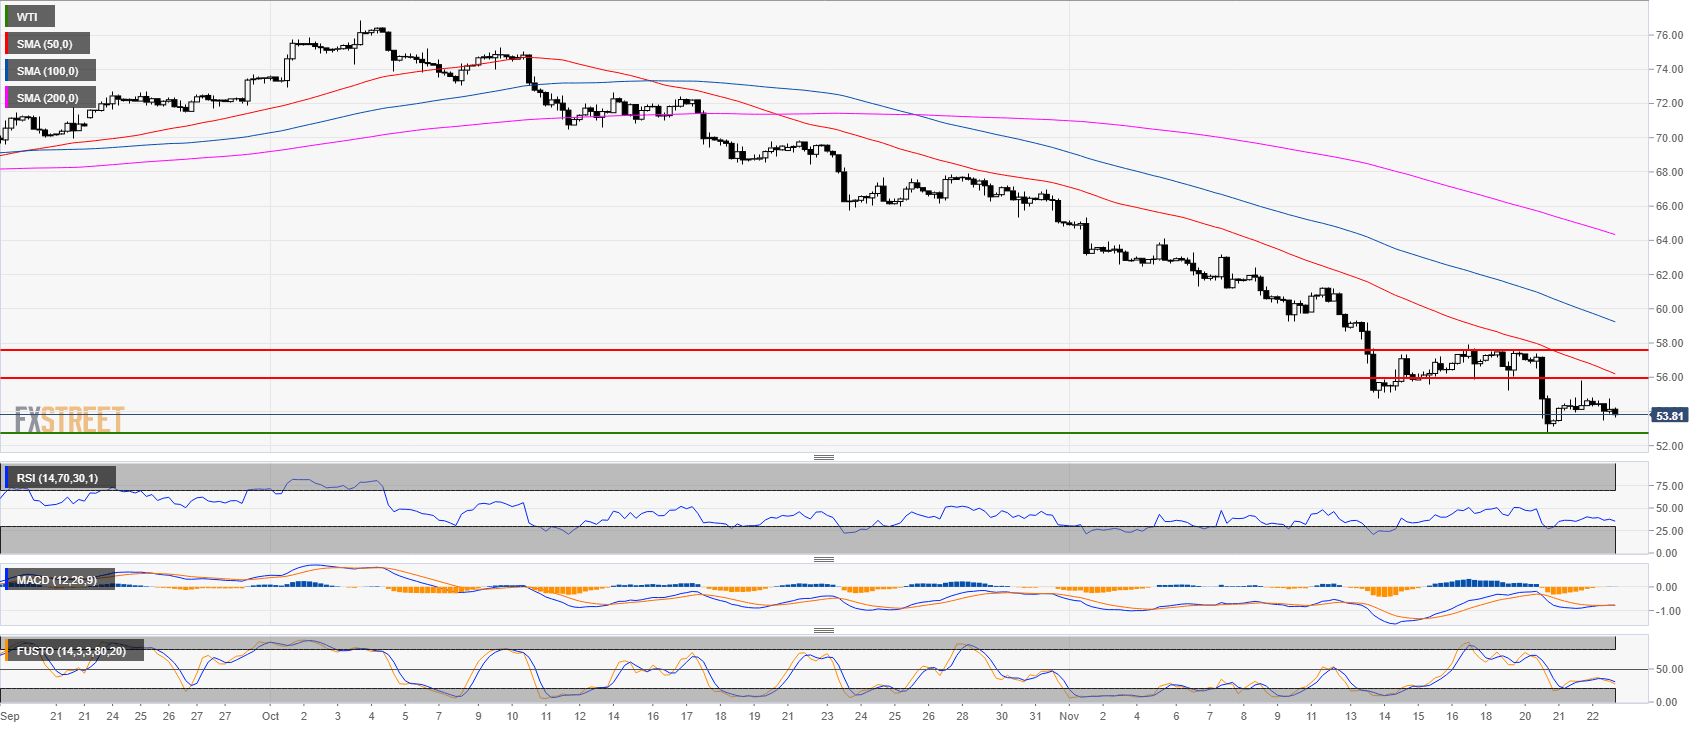
Crude oil 4-hour chart
- Oil rejected the 56.00 level opening the doors to the next support at 52.74, the 2018 low.
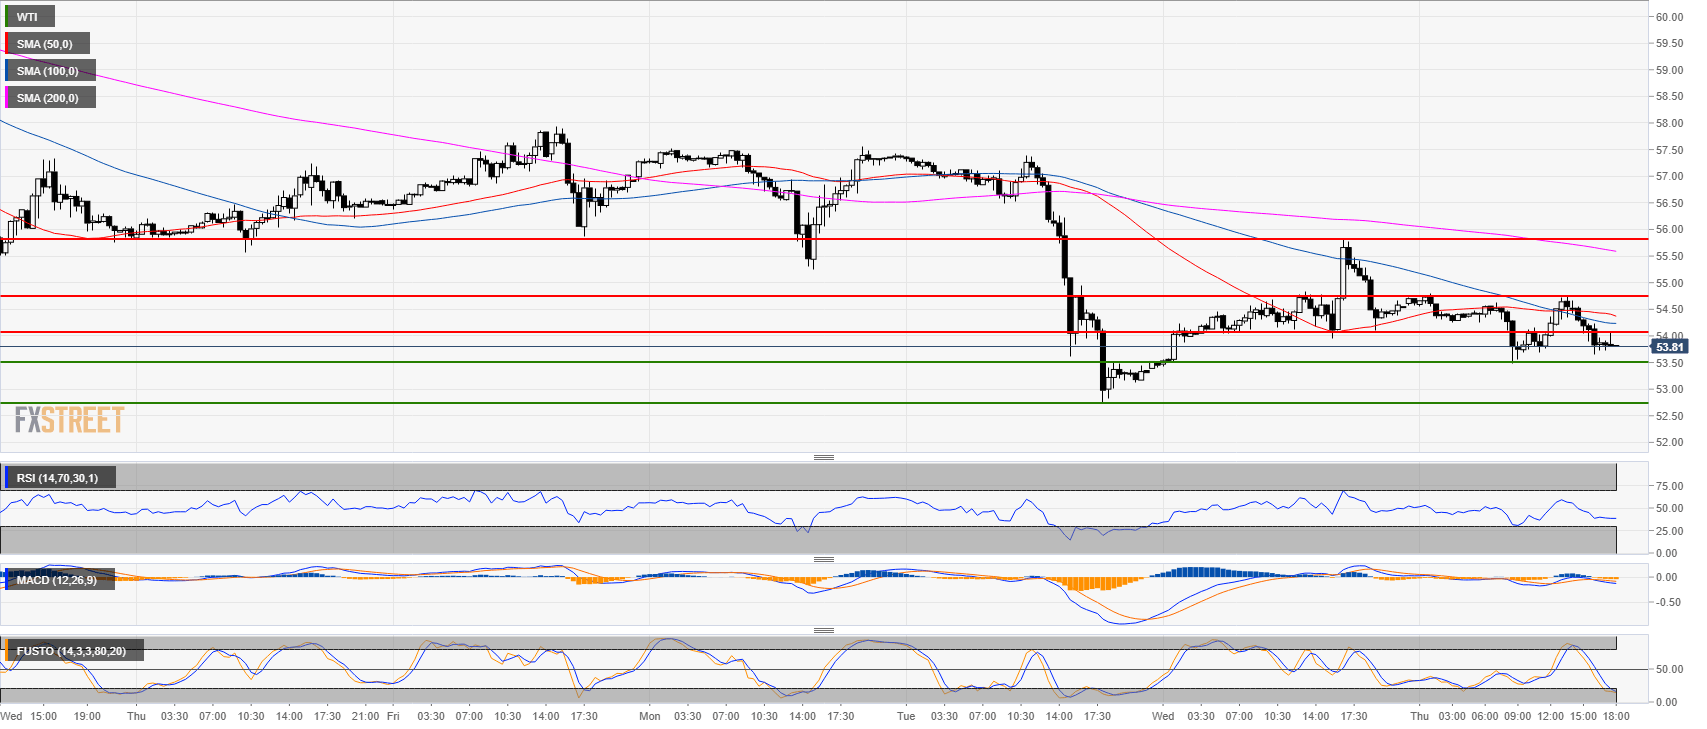
Crude oil 30-minute chart
- Oil is trading below all its main SMAs while technical indicators are bearish.
- The first target is 53.50 followed by 52.74, the 2018 low.
Additional key levels
WTI
Overview:
Last Price: 53.81
Daily change: -81 pips
Daily change: -1.48%
Daily Open: 54.62
Trends:
Daily SMA20: 59.74
Daily SMA50: 66.72
Daily SMA100: 67.61
Daily SMA200: 68.09
Levels:
Daily High: 54.73
Daily Low: 54.58
Weekly High: 60.93
Weekly Low: 55.21
Monthly High: 76.25
Monthly Low: 64.86
Daily Fibonacci 38.2%: 54.67
Daily Fibonacci 61.8%: 54.64
Daily Pivot Point S1: 54.56
Daily Pivot Point S2: 54.49
Daily Pivot Point S3: 54.41
Daily Pivot Point R1: 54.71
Daily Pivot Point R2: 54.79
Daily Pivot Point R3: 54.86
