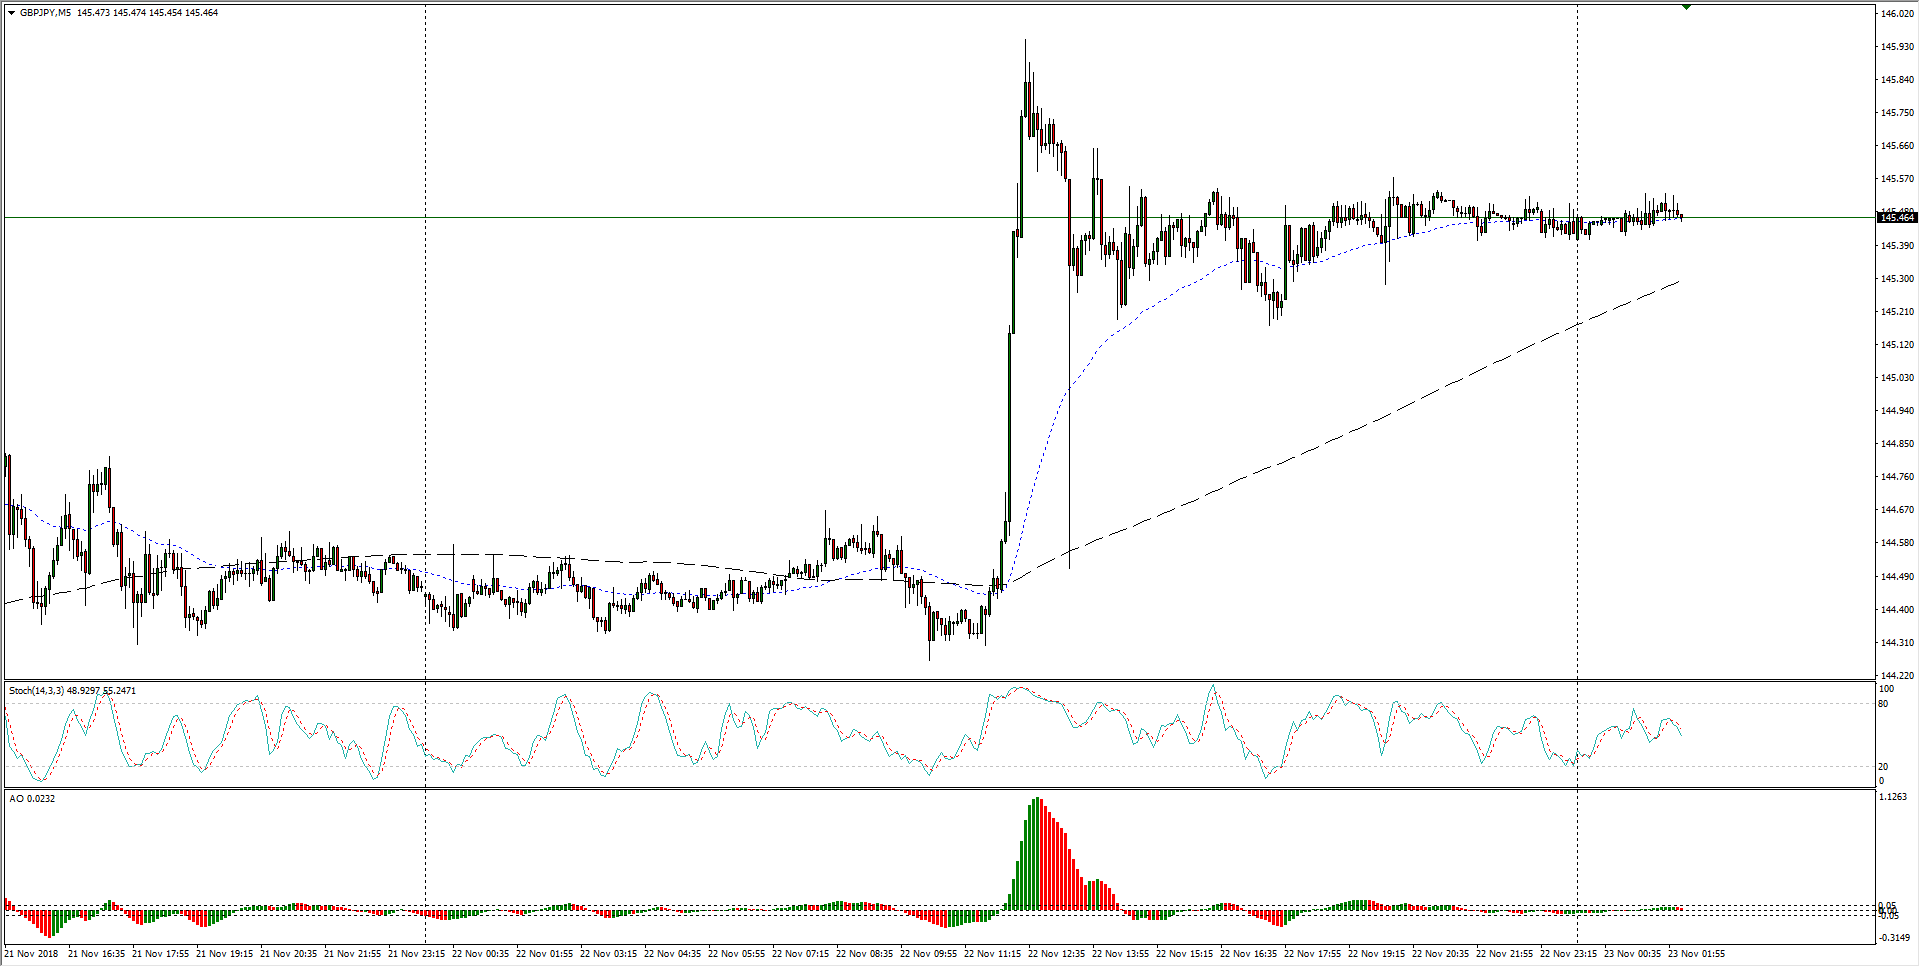
- Thursday’s mid-session announcement of tentative Brexit agreements between the EU and the UK saw the Sterling surge across the board.
- A messy rebound period saw the GBP/JPY get jostled before settling near a new near-term median at the 145.50 region.
GBP/JPY Chart, 5-Minute
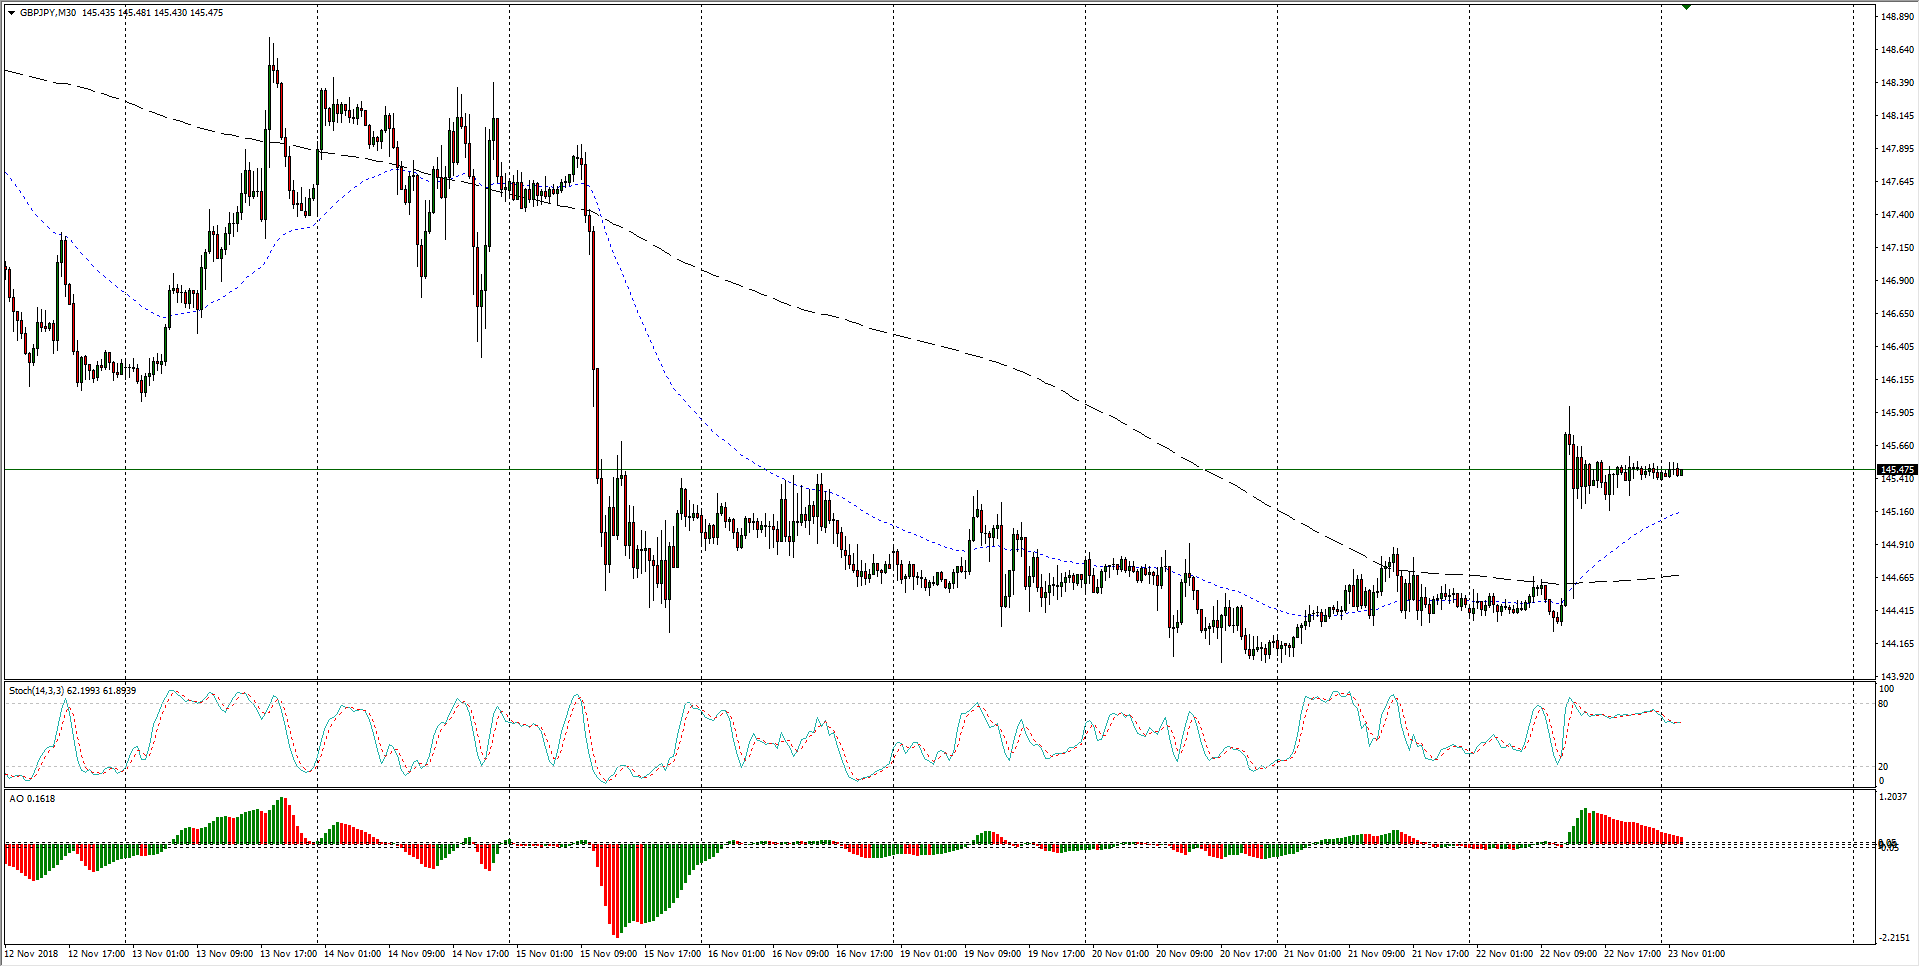
- The past two weeks have seen the Guppy take a significant step down, and even Thursday’s Brexit upmove sees the pair trapped significantly towards the downside following mid-November’s decline from the 148.70 region.
GBP/JPY Chart, 30-Minute
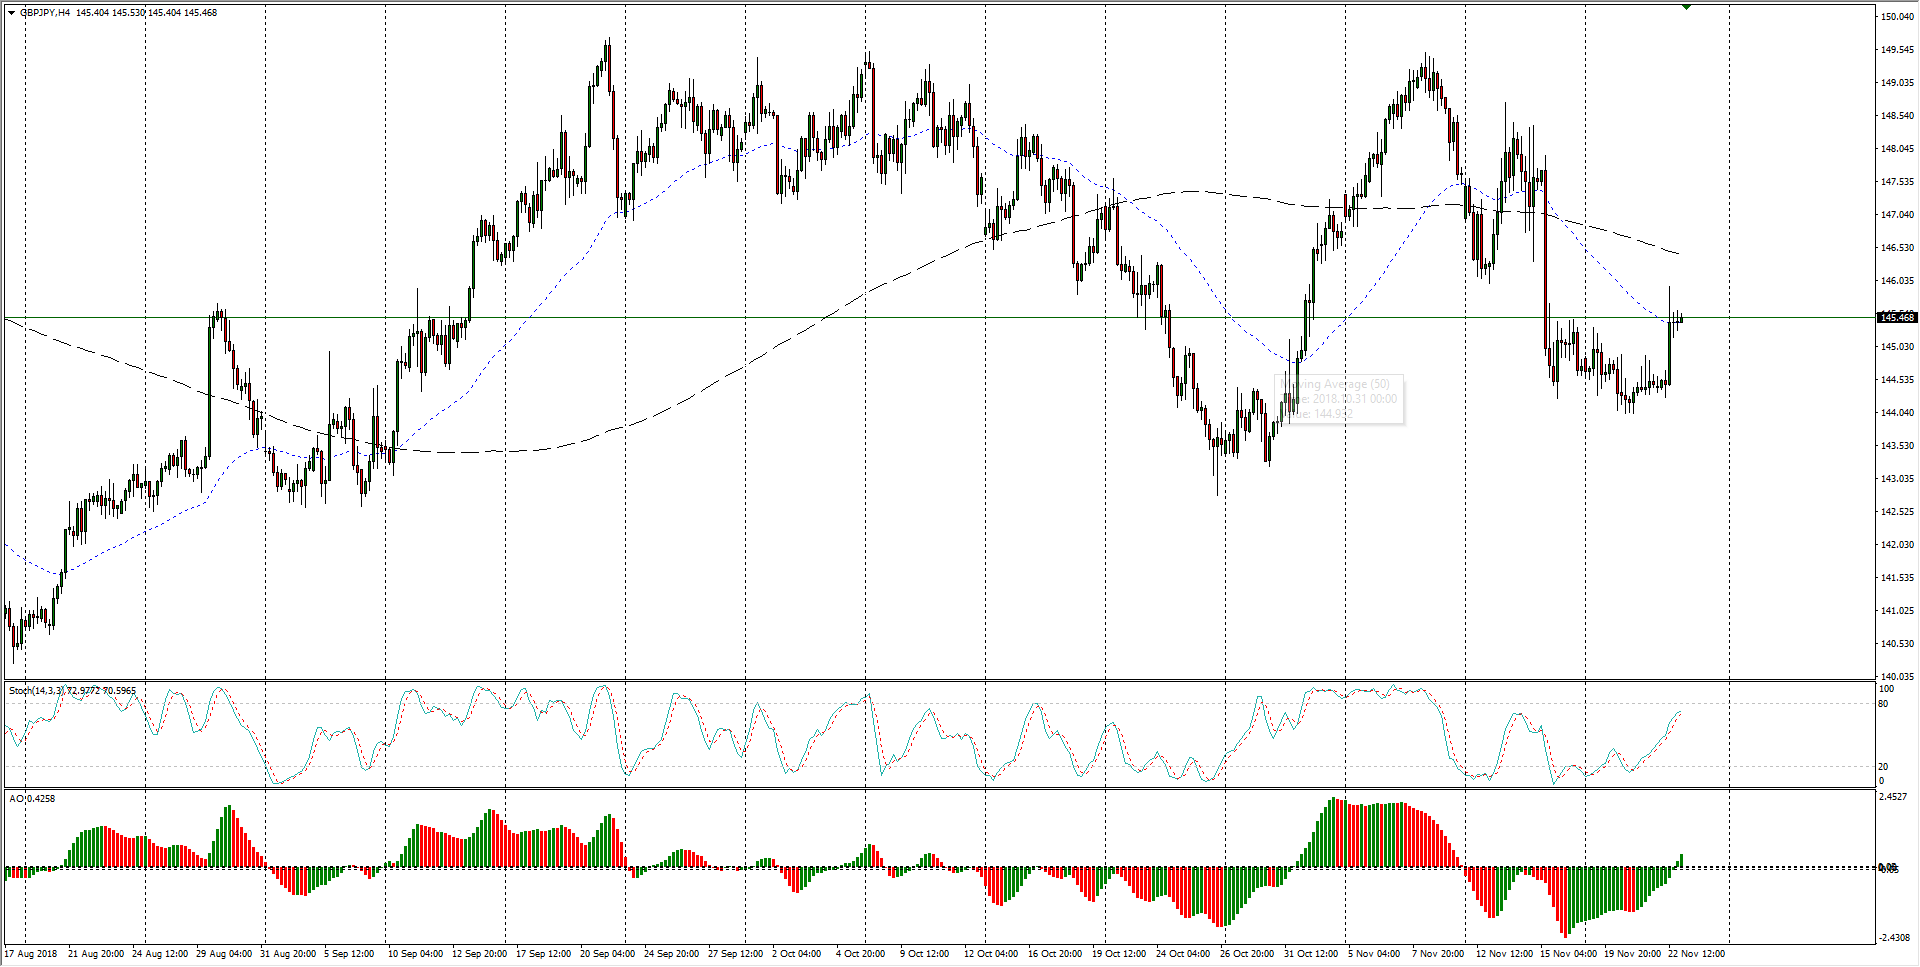
- The Guppy is threatening to roll over into a lateral cycle, moving sideways since peaking just shy of the 150.00 major handle in late September, and finding a floor between 144.00 and 142.00.
GBP/JPY Chart, 4-Hour
GBP/JPY
Overview:
Last Price: 145.49
Daily change: -1.0 pips
Daily change: -0.00687%
Daily Open: 145.5
Trends:
Daily SMA20: 146.01
Daily SMA50: 146.94
Daily SMA100: 145.8
Daily SMA200: 147.09
Levels:
Daily High: 145.96
Daily Low: 144.26
Weekly High: 148.74
Weekly Low: 144.26
Monthly High: 149.52
Monthly Low: 142.78
Daily Fibonacci 38.2%: 145.31
Daily Fibonacci 61.8%: 144.91
Daily Pivot Point S1: 144.52
Daily Pivot Point S2: 143.54
Daily Pivot Point S3: 142.82
Daily Pivot Point R1: 146.22
Daily Pivot Point R2: 146.94
Daily Pivot Point R3: 147.92
