- The AUD/USD is seeing some limited play into the short-side in early Friday trading, but the Aussie-Dollar pairing remains largely chained to the 0.7250 region.
- The Japanese market holiday will be draining volume out of markets, and the AUD/USD is set to remain trapped in place after Thursday marked in a hard inside day.
AUD/USD Chart, 5-Minute
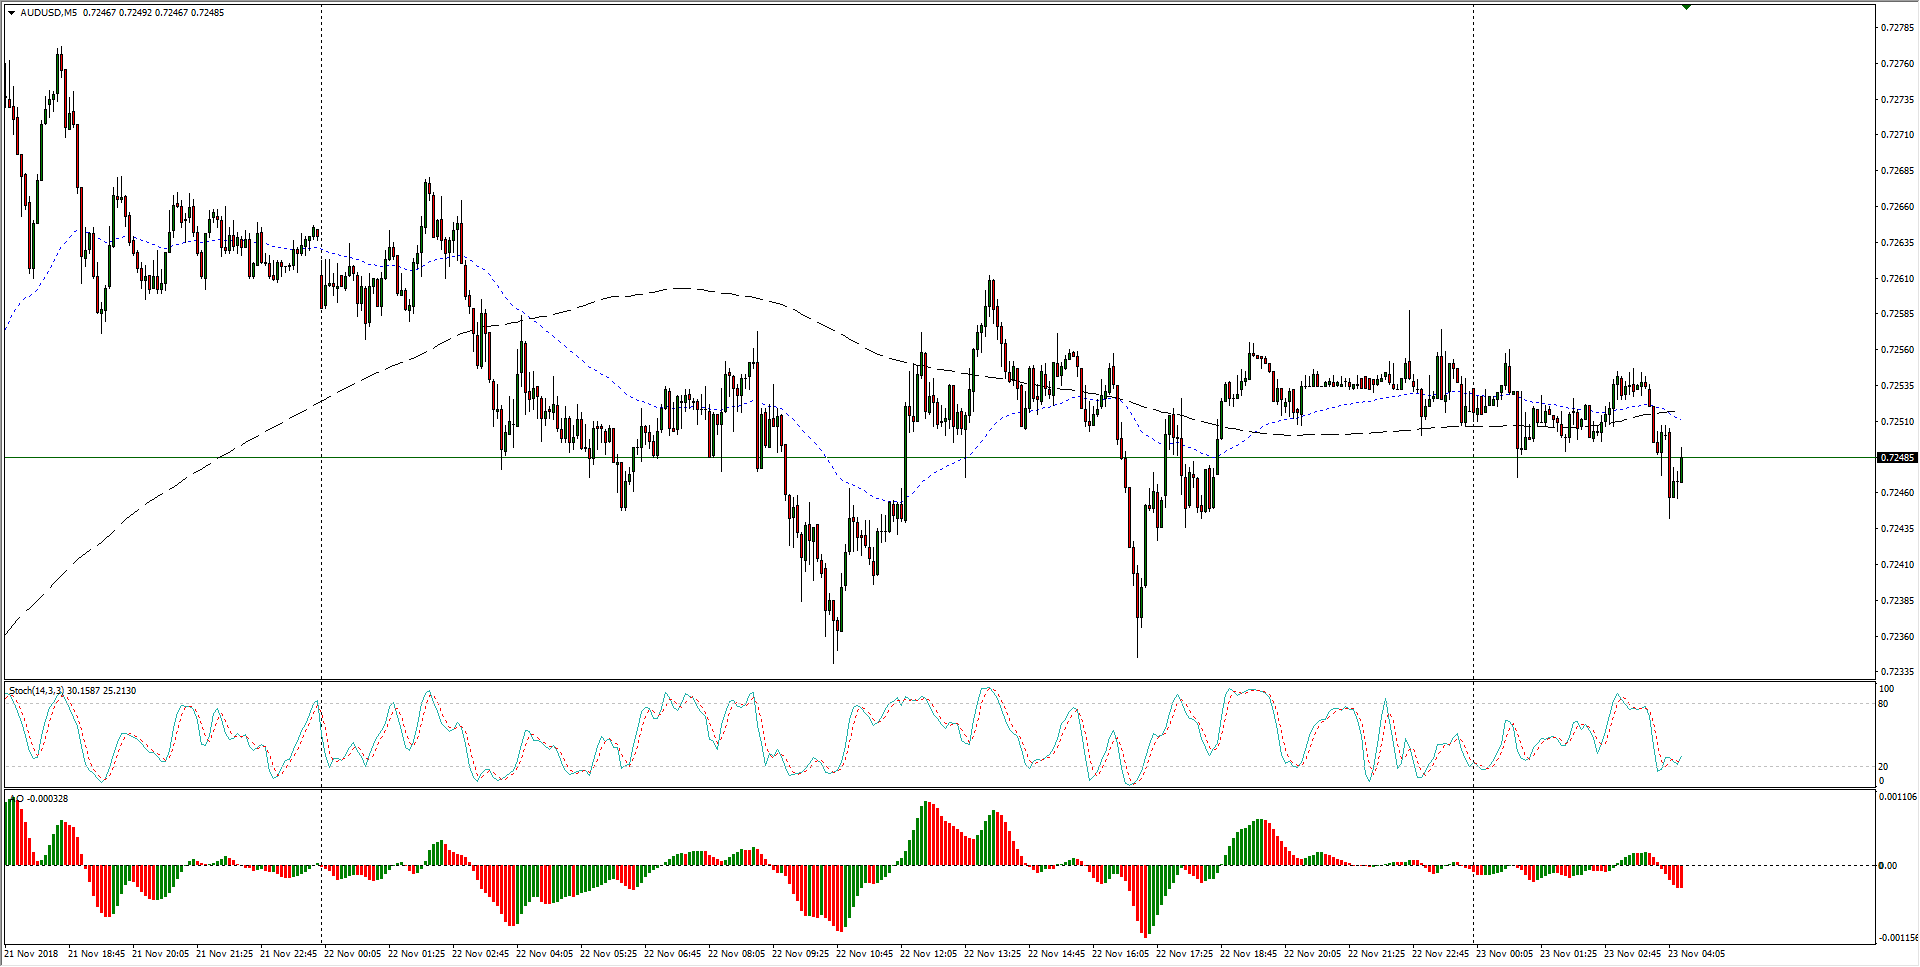
- The past two weeks see the AUD/USD hung up on a key level between major swing points, warning of an excessive middling pattern in the AUD/USD.
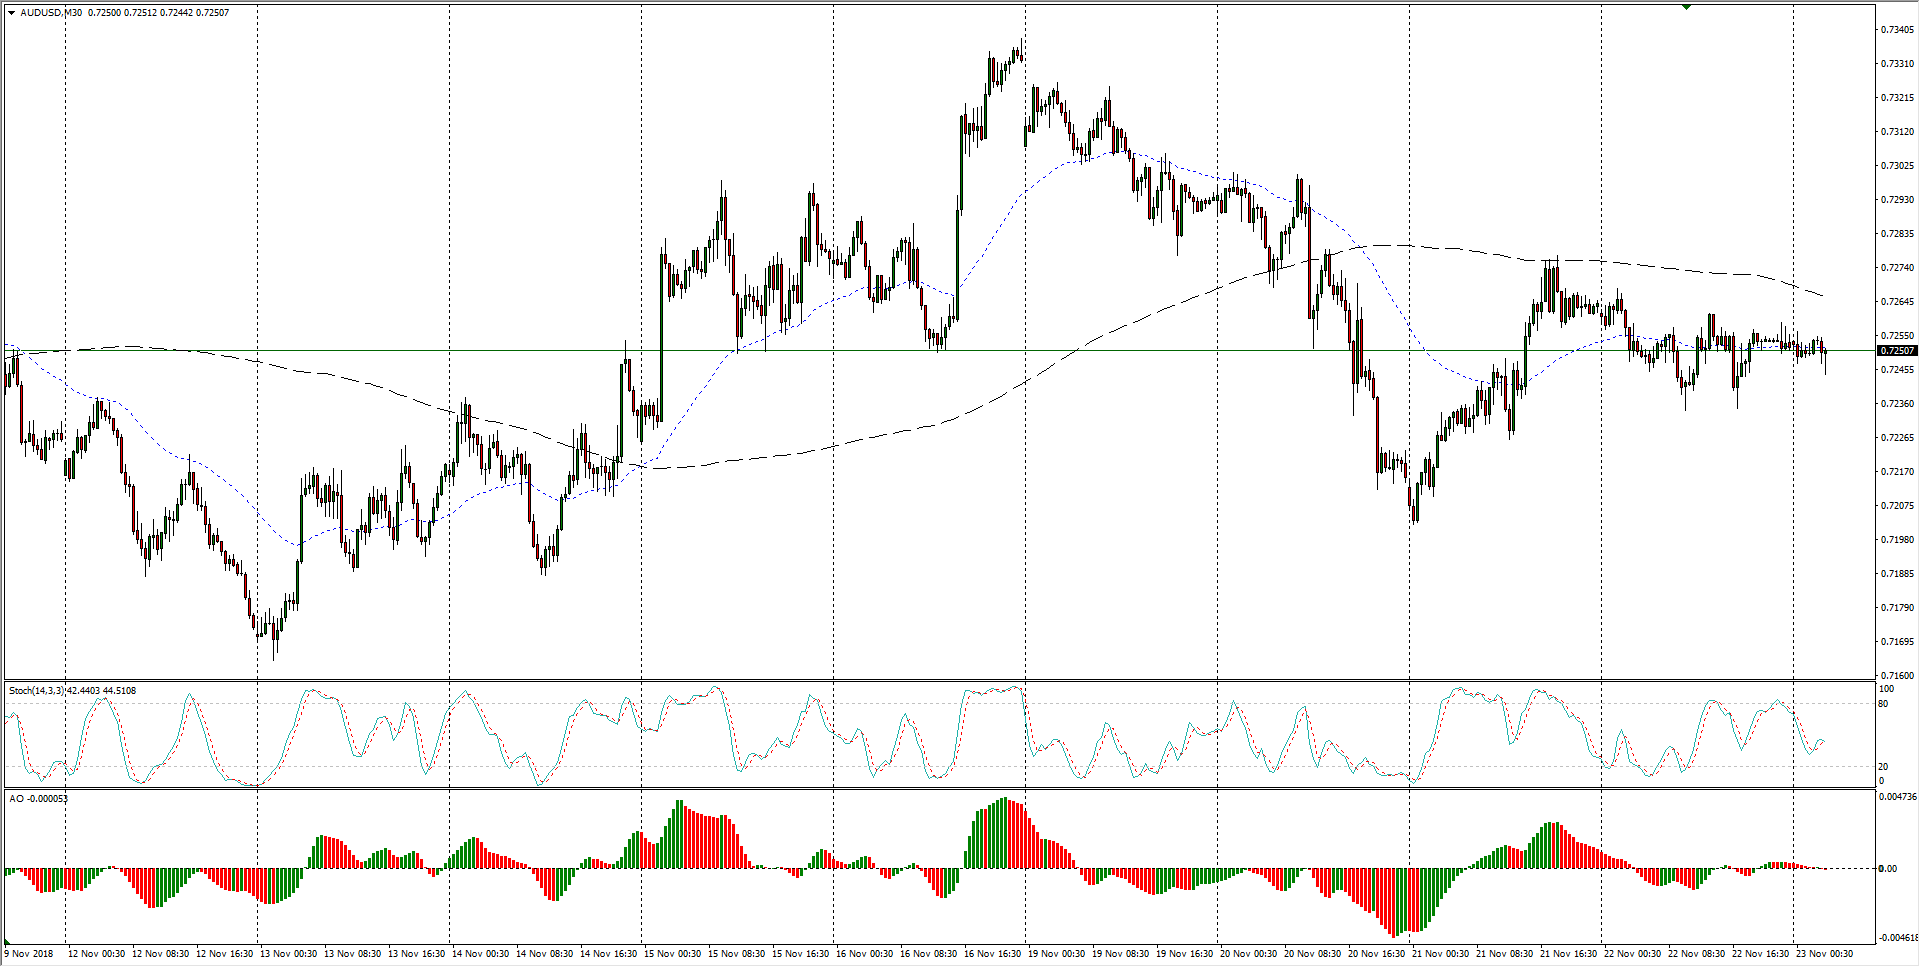
AUD/USD Chart, 30-Minute
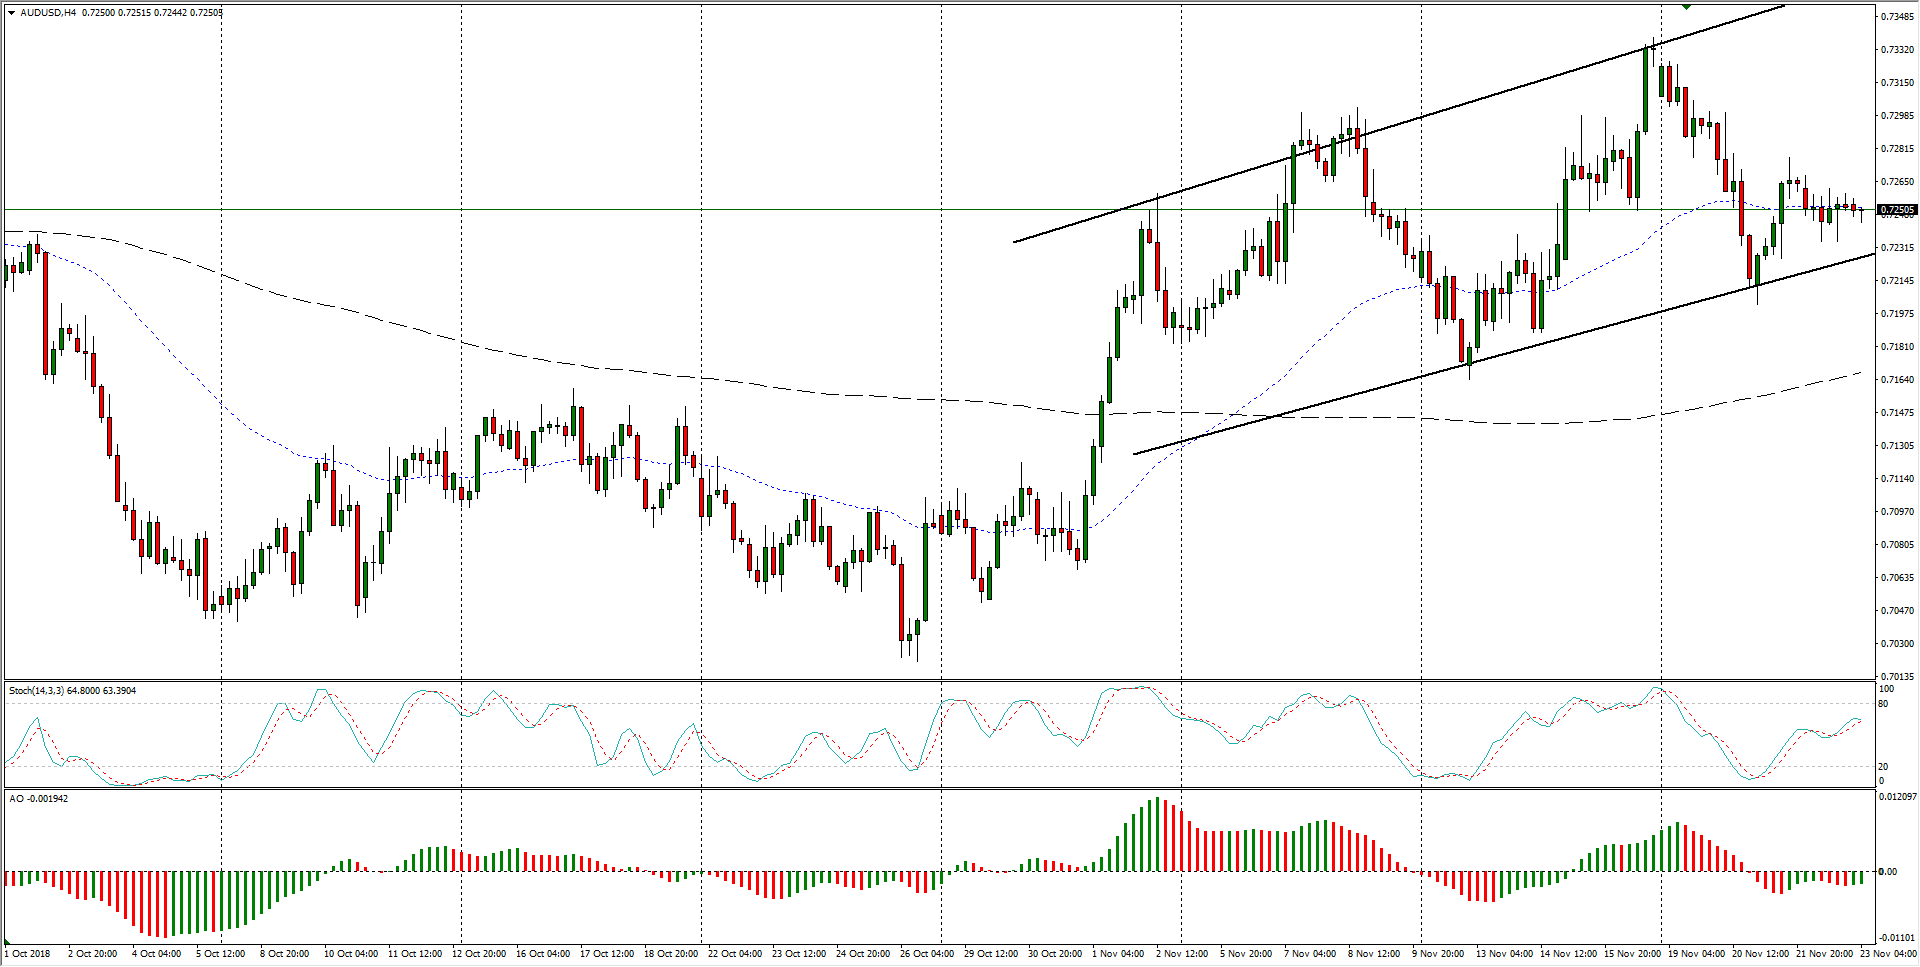
- Despite rough cyclical action in the near-term, the medium-term AUD/USD chart sees the potential for a rising channel confirmation, assuming the Aussie manages to bounce from no lower than the 0.7230 region.
AUD/USD Chart, 4-Hour
AUD/USD
Overview:
Last Price: 0.7247
Daily change: -5.0 pips
Daily change: -0.0689%
Daily Open: 0.7252
Trends:
Daily SMA20: 0.721
Daily SMA50: 0.7176
Daily SMA100: 0.7252
Daily SMA200: 0.7442
Levels:
Daily High: 0.727
Daily Low: 0.7234
Weekly High: 0.7336
Weekly Low: 0.7164
Monthly High: 0.724
Monthly Low: 0.702
Daily Fibonacci 38.2%: 0.7247
Daily Fibonacci 61.8%: 0.7256
Daily Pivot Point S1: 0.7233
Daily Pivot Point S2: 0.7215
Daily Pivot Point S3: 0.7197
Daily Pivot Point R1: 0.727
Daily Pivot Point R2: 0.7288
Daily Pivot Point R3: 0.7306
