- Thursday’s GBP/USD drive on Brexit headlines saw the pair reset to a new technical level, though the Cable is resuming its sideways pattern after reclaiming 1.2870 yesterday.
GBP/USD Chart, 5-Minute
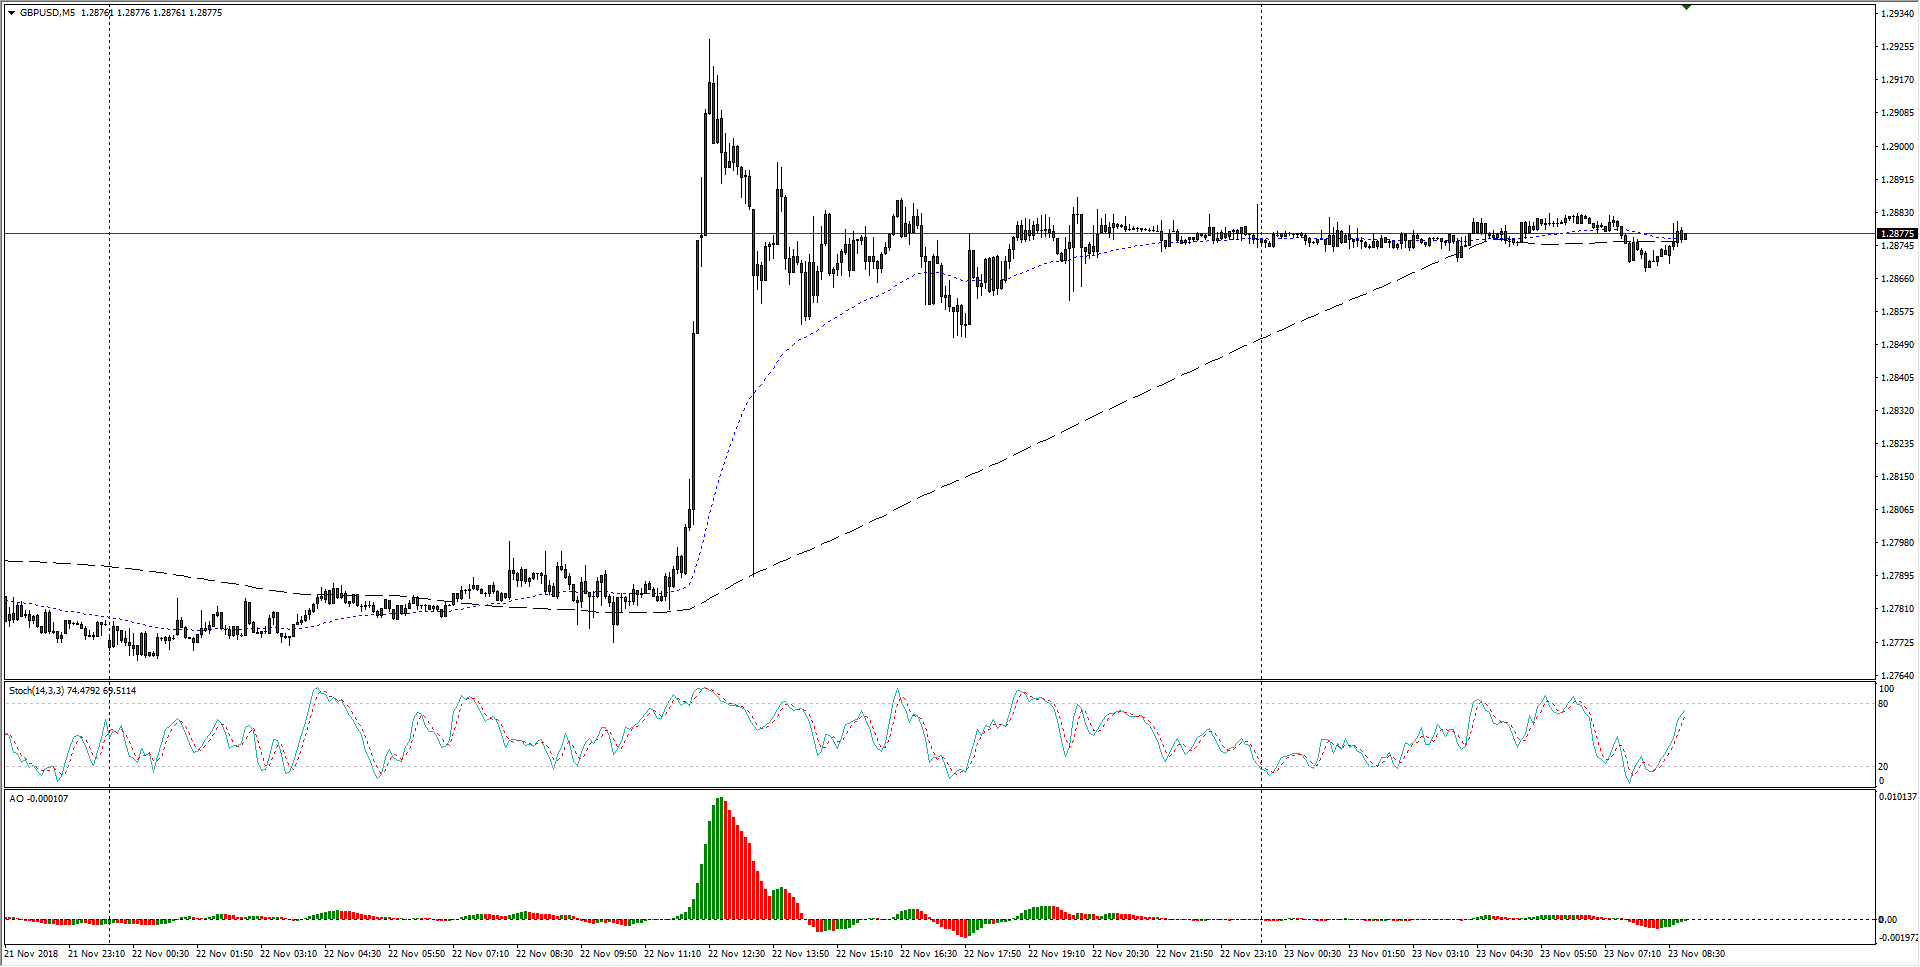
- The Cable’s near-term constraining pattern is trading into familiar top-end peaks, and Thursday’s Brexit jump could prove to be a false move.
GBP/USD Chart, 30-Minute
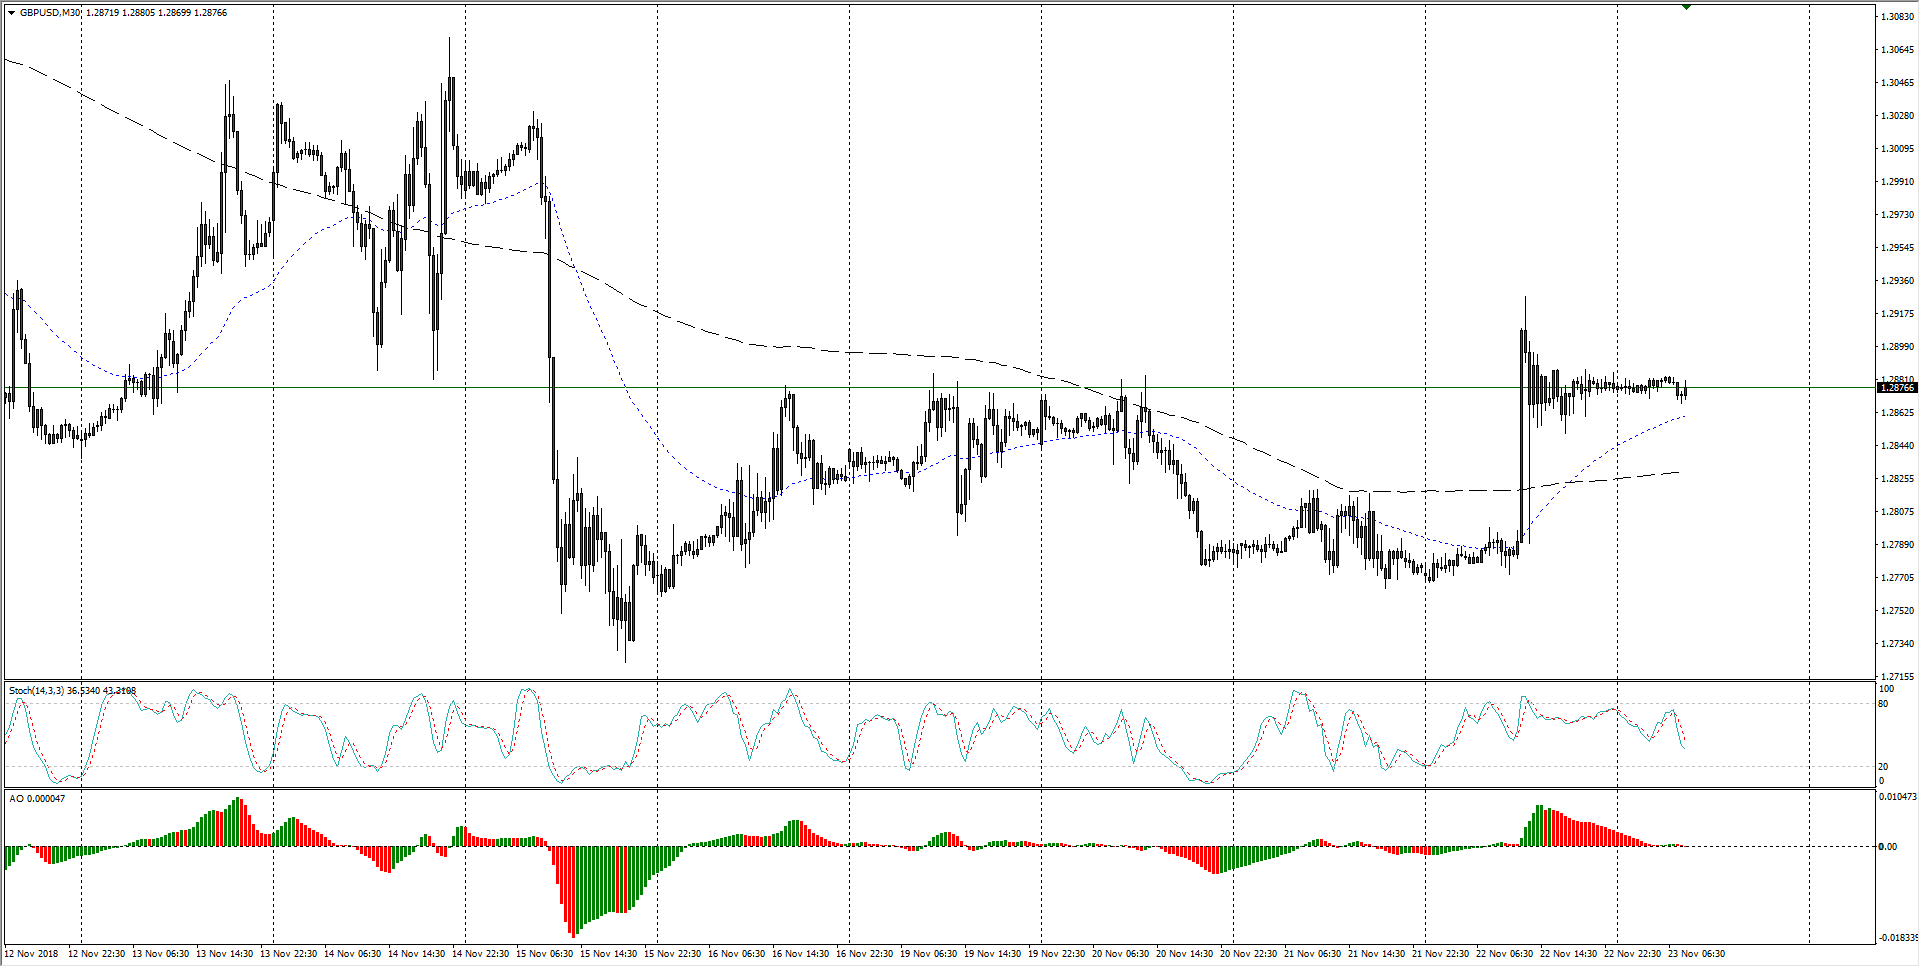
- The Cable is beginning to form a tightening triangle pattern, with lower highs and higher lows squeezing the action into a potential breakout play from near the 1.3000 handle.
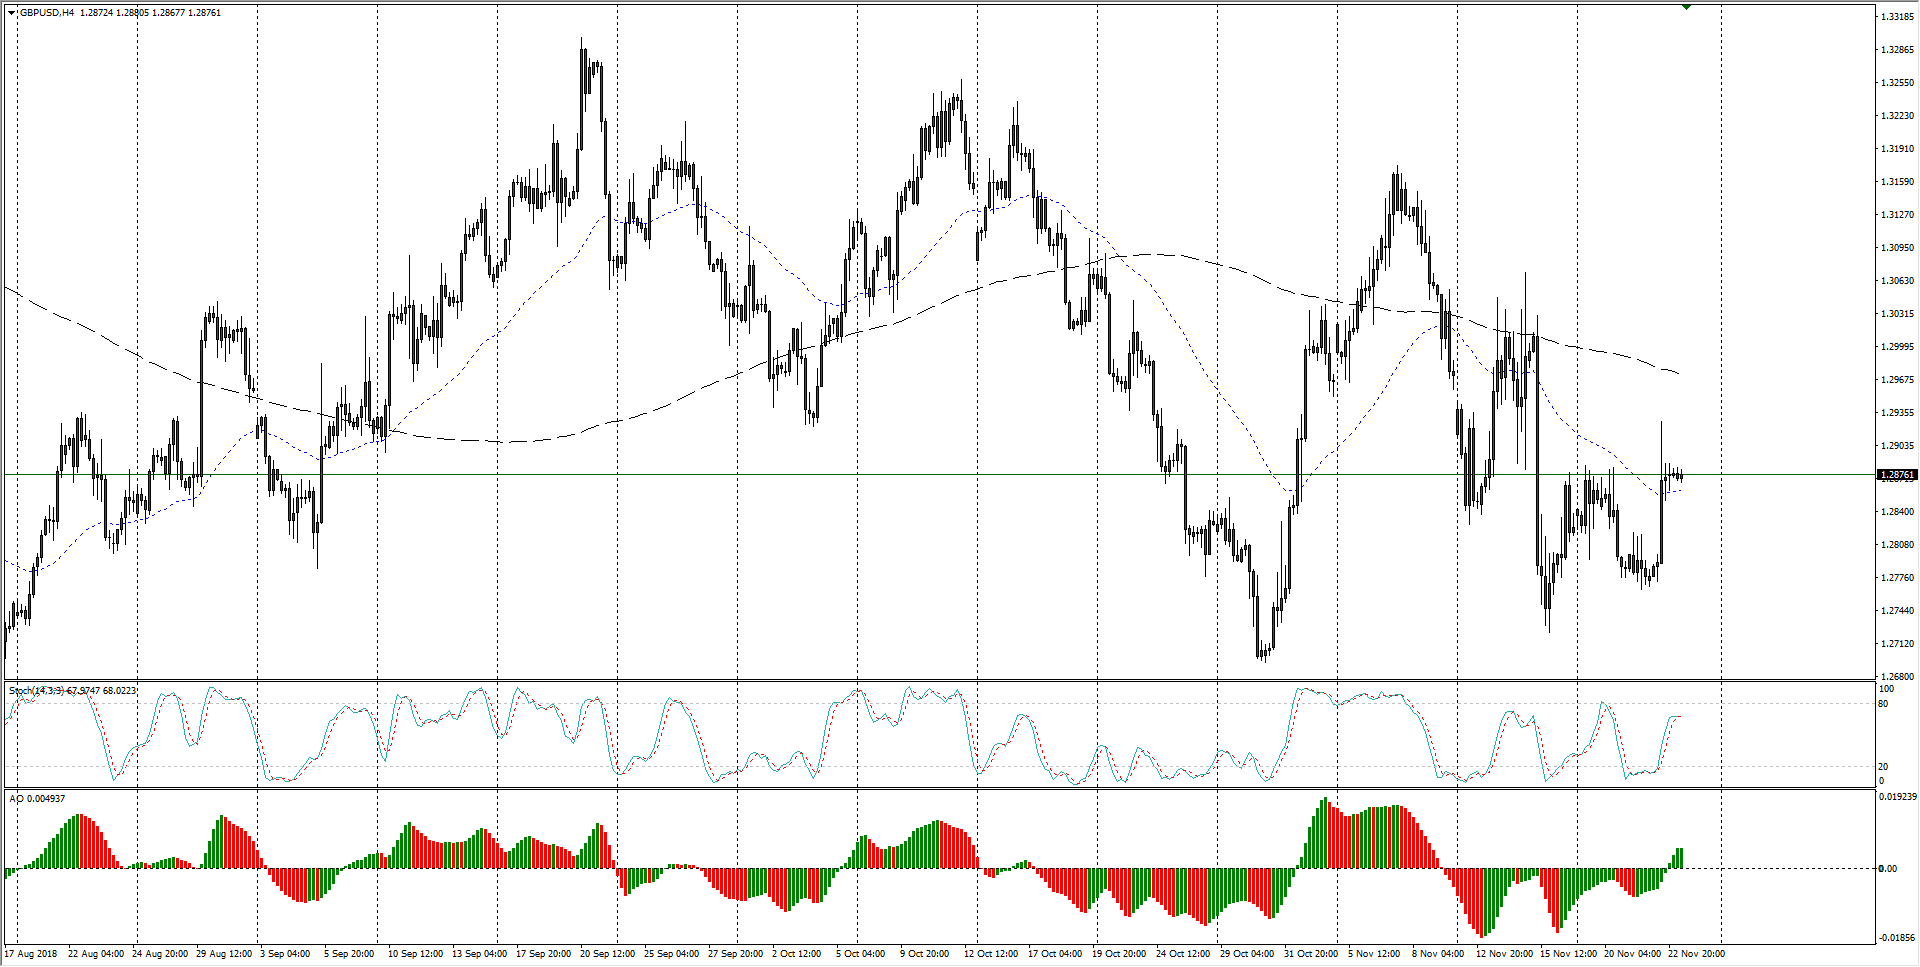
GBP/USD Chart, 4-Hour
GBP/USD
Overview:
Last Price: 1.2878
Daily change: -2.0 pips
Daily change: -0.0155%
Daily Open: 1.288
Trends:
Daily SMA20: 1.2904
Daily SMA50: 1.3012
Daily SMA100: 1.3004
Daily SMA200: 1.3353
Levels:
Daily High: 1.2928
Daily Low: 1.277
Weekly High: 1.3074
Weekly Low: 1.2724
Monthly High: 1.326
Monthly Low: 1.2696
Daily Fibonacci 38.2%: 1.2868
Daily Fibonacci 61.8%: 1.283
Daily Pivot Point S1: 1.279
Daily Pivot Point S2: 1.2701
Daily Pivot Point S3: 1.2631
Daily Pivot Point R1: 1.2949
Daily Pivot Point R2: 1.3018
Daily Pivot Point R3: 1.3108
