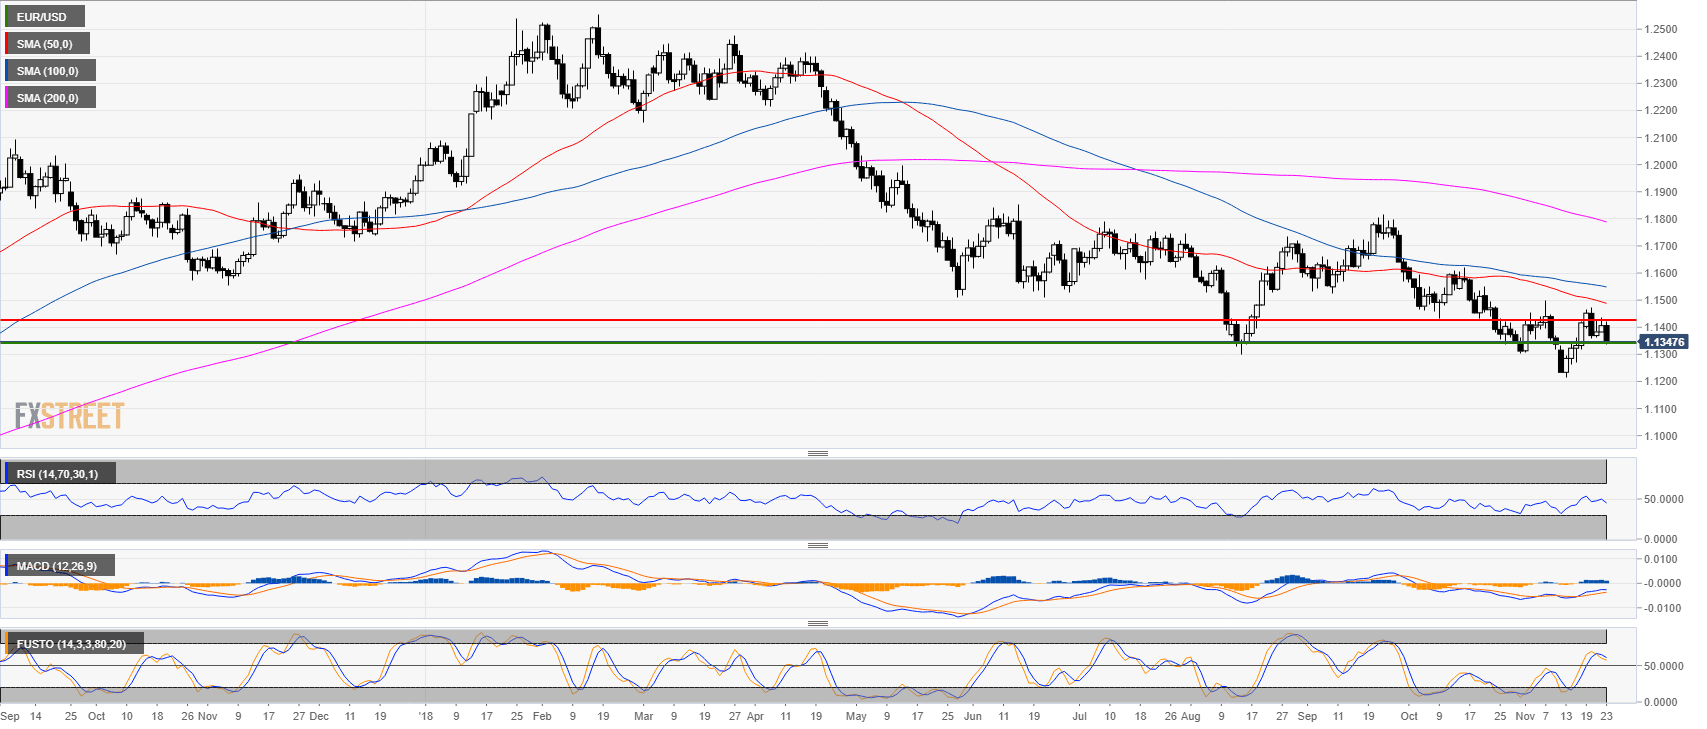
EUR/USD daily chart
- EUR/USD is trading below its main simple moving averages (SMAs) on the daily chart.
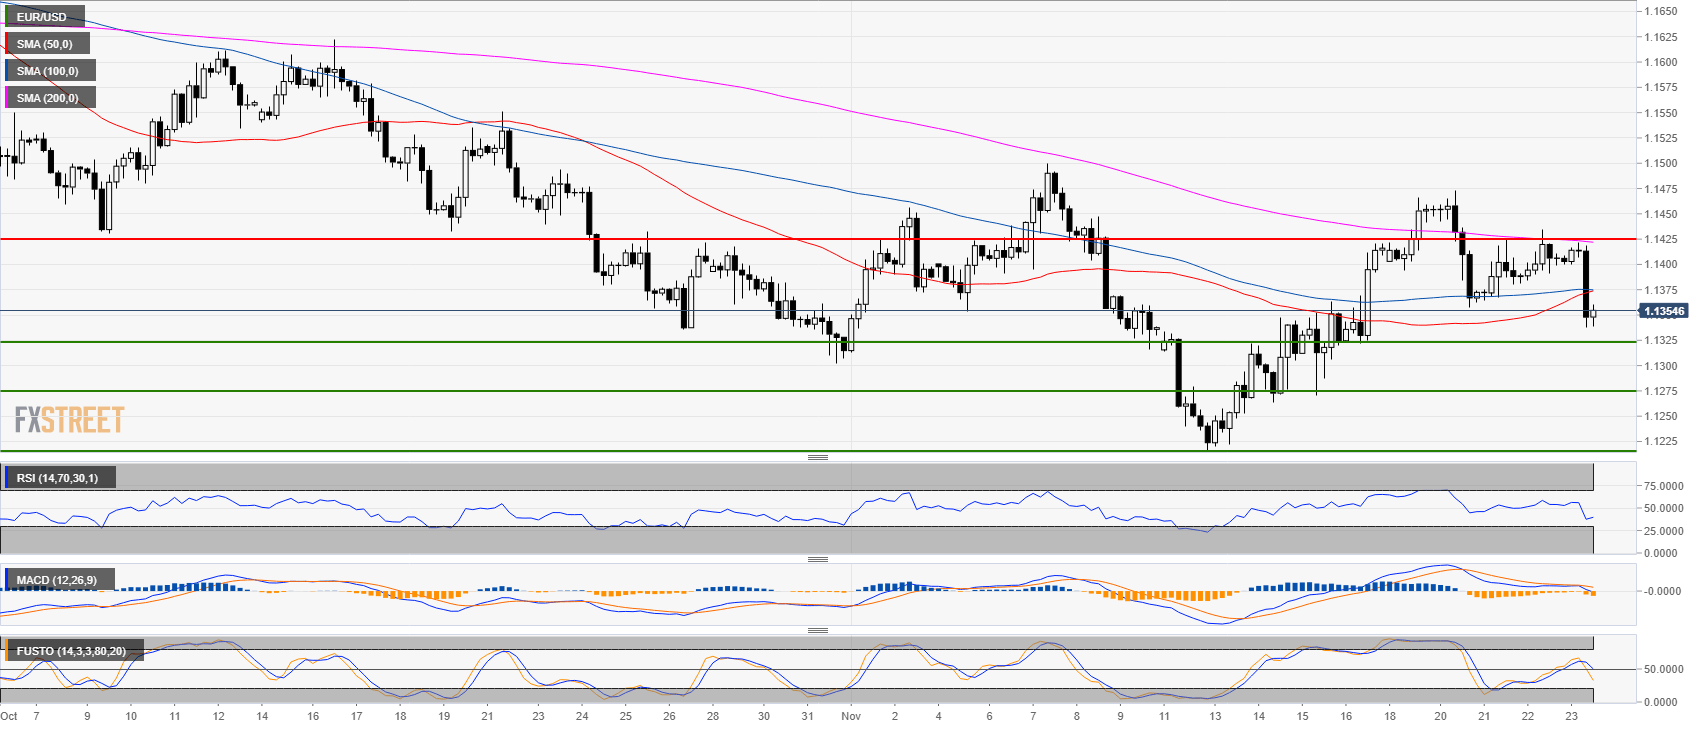
EUR/USD 4-hour chart
- EUR/USD is trading in a bear trend below the 200-period simple moving average on the 4-hour chart.
- The RSI is below the 50 line, the MACD is slightly weakening while the Stochastic is above the 50 line.
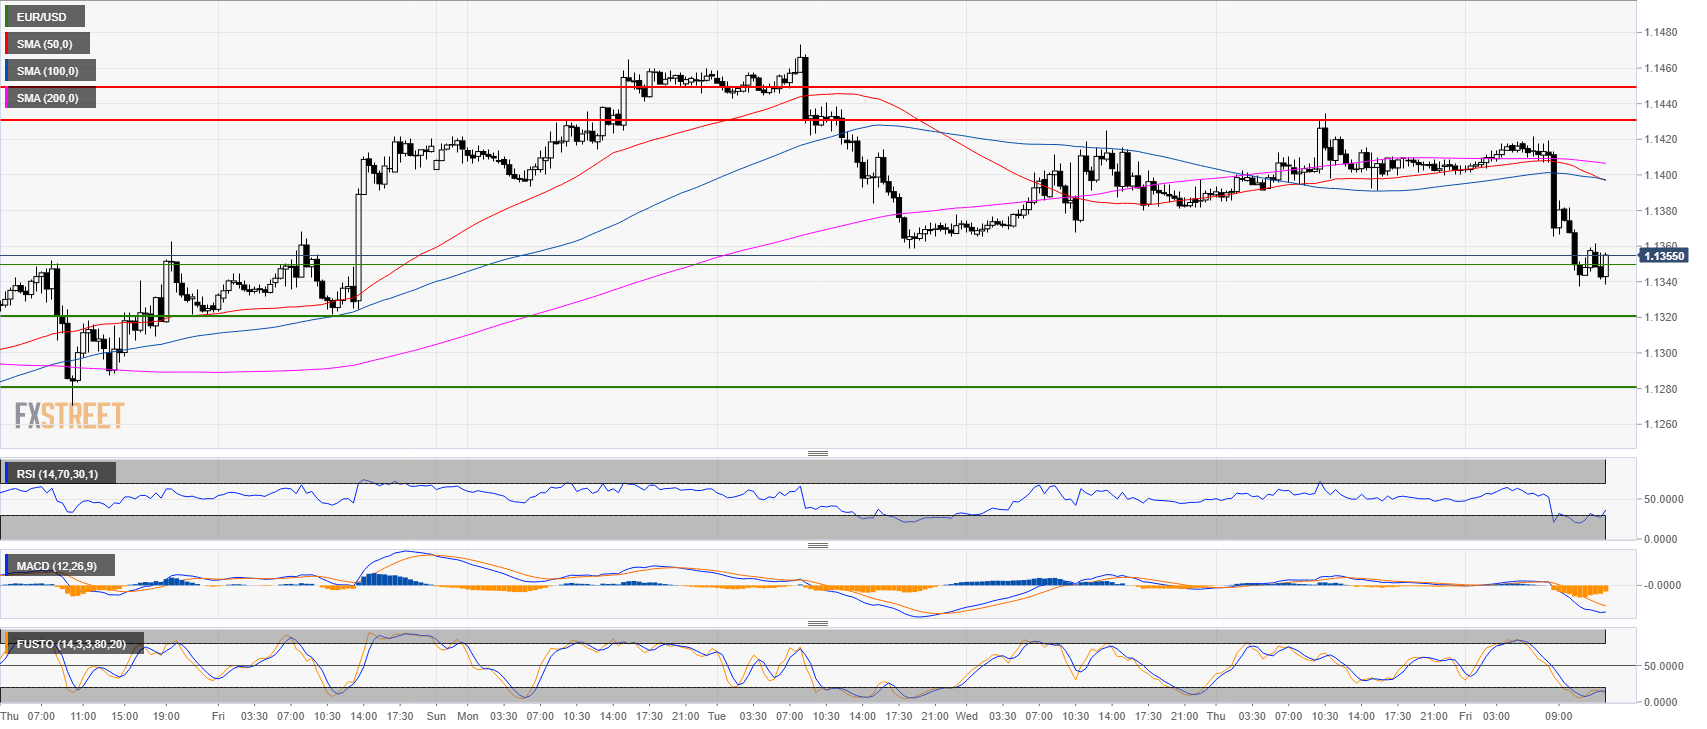
EUR/USD 30-minute chart
- EUR/USD broke below the 1.1400 figure and the flat 50 and 100 SMAs as technical indicators are bearish.
- The next target to the downside is seen at the 1.3220 and 1.1275 levels. However, any further big losses seem to be limited this Friday.
Additional key levels
EUR/USD
Overview:
Last Price: 1.135
Daily change: -56 pips
Daily change: -0.491%
Daily Open: 1.1406
Trends:
Daily SMA20: 1.137
Daily SMA50: 1.1494
Daily SMA100: 1.1553
Daily SMA200: 1.1797
Levels:
Daily High: 1.1434
Daily Low: 1.1381
Weekly High: 1.142
Weekly Low: 1.1216
Monthly High: 1.1625
Monthly Low: 1.1302
Daily Fibonacci 38.2%: 1.1414
Daily Fibonacci 61.8%: 1.1402
Daily Pivot Point S1: 1.138
Daily Pivot Point S2: 1.1354
Daily Pivot Point S3: 1.1327
Daily Pivot Point R1: 1.1433
Daily Pivot Point R2: 1.1461
Daily Pivot Point R3: 1.1487
