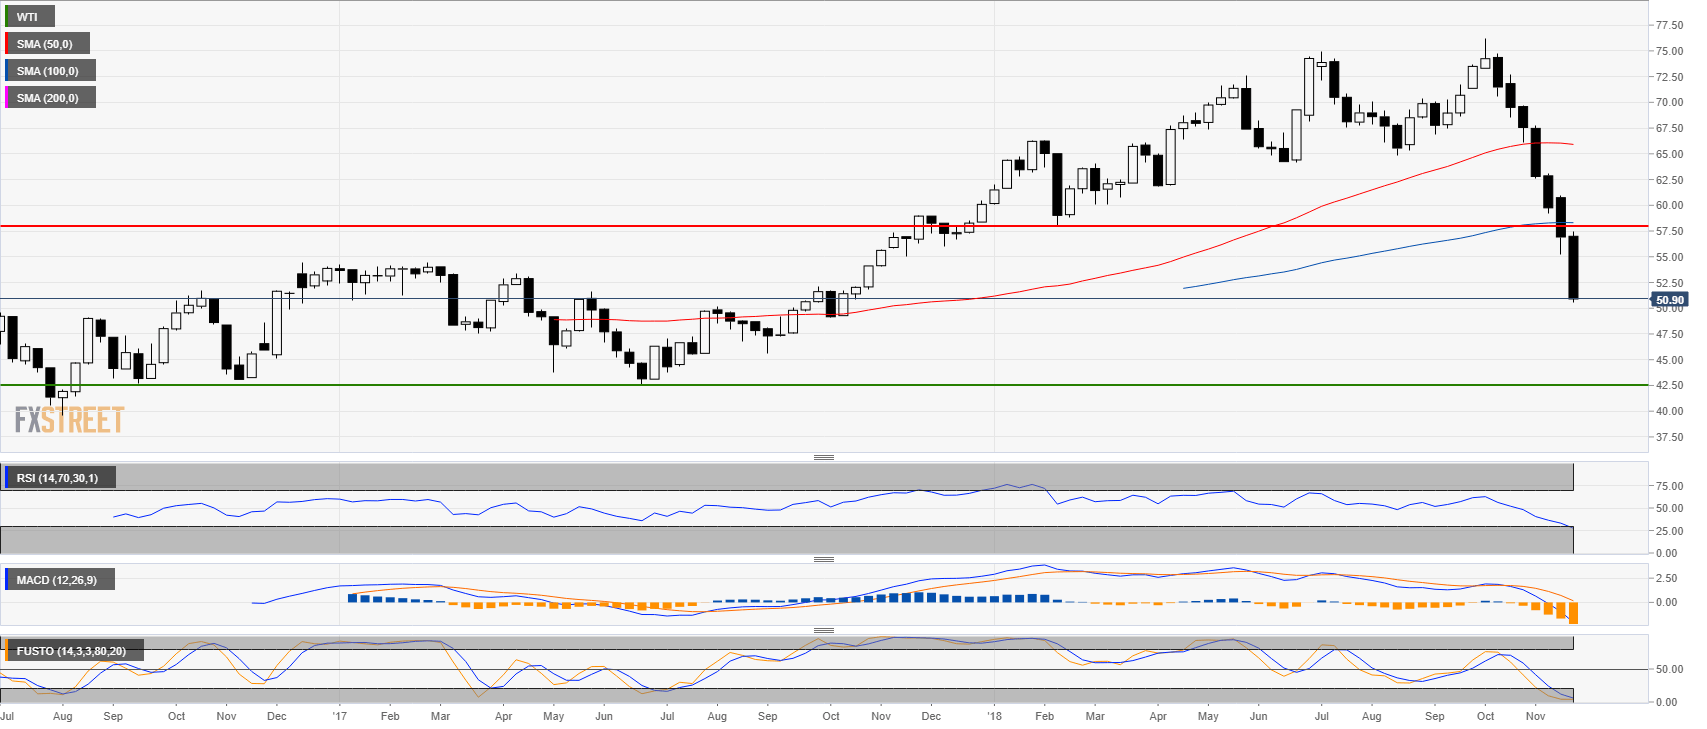
Crude oil weekly chart
- Crude oil is in a steep bear trend as it reversed the yearly gains.
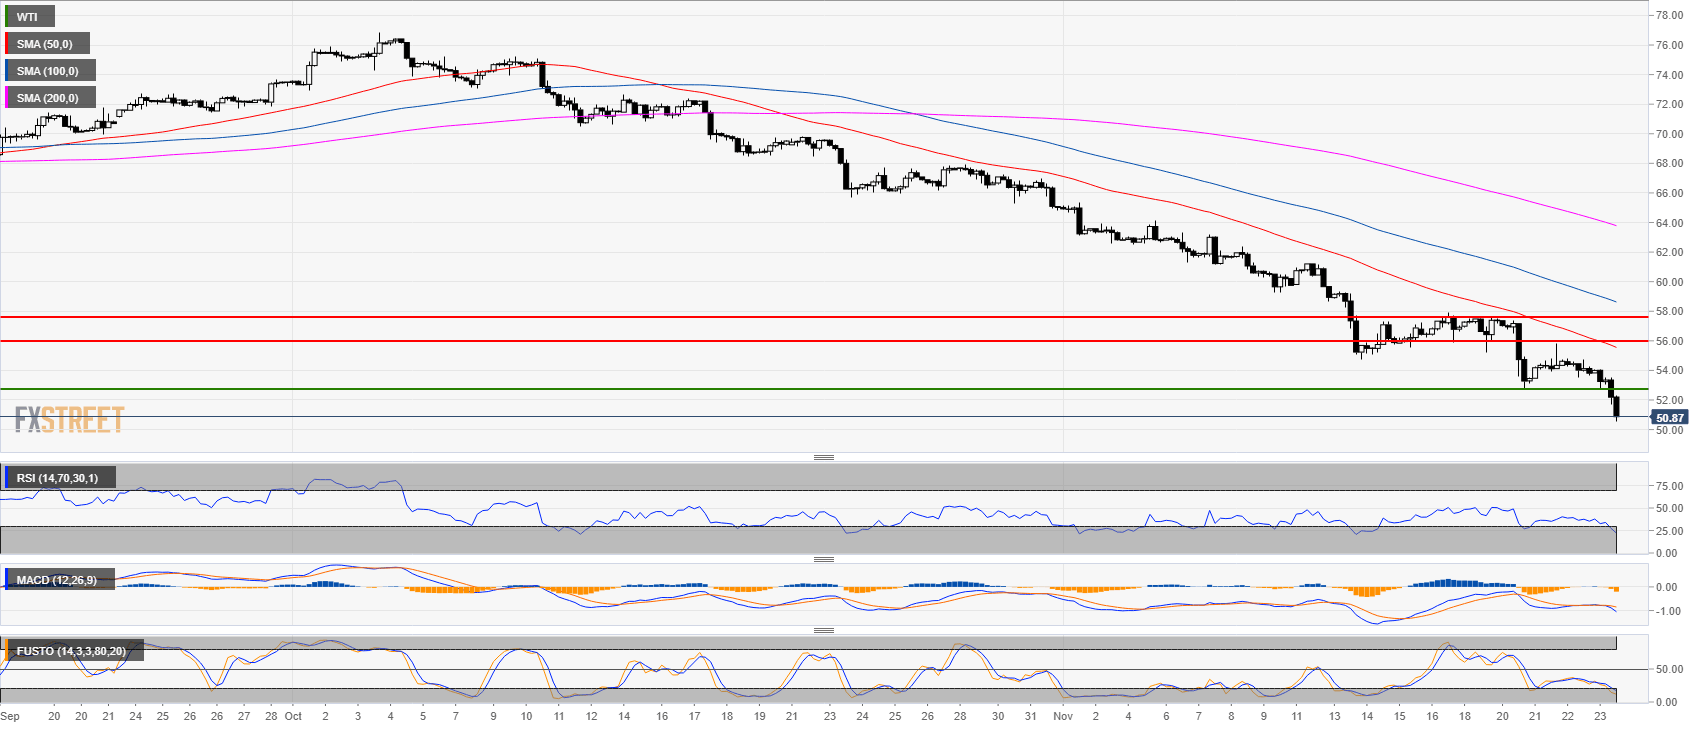
Crude oil 4-hour chart
- Oil bears smashed through the former 2018 low.
- The RSI, MACD and Stochastic are all pointing to more losses.
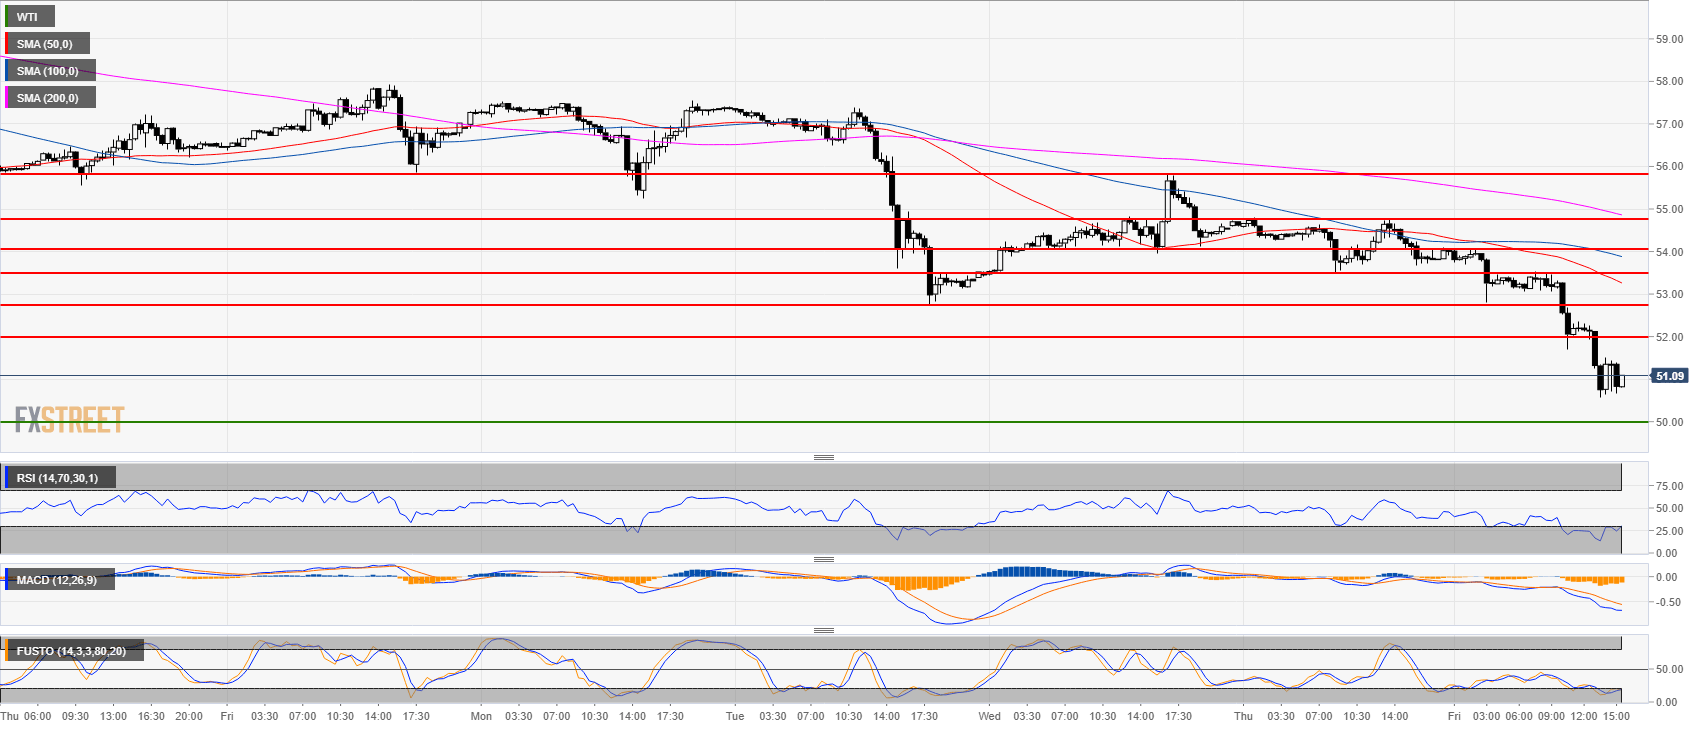
Crude oil 30-minute chart
- WTI is consolidating the recent losses just above the 50.50 level.
- Technical indicators are bearish although oversold.
- $50.00 a barrel is likely the next target for bears.
Additional key levels
WTI
Overview:
Last Price: 50.84
Daily change: -3.2e+2 pips
Daily change: -5.85%
Daily Open: 54
Trends:
Daily SMA20: 59.12
Daily SMA50: 66.36
Daily SMA100: 67.46
Daily SMA200: 68.05
Levels:
Daily High: 54.09
Daily Low: 53.84
Weekly High: 60.93
Weekly Low: 55.21
Monthly High: 76.25
Monthly Low: 64.86
Daily Fibonacci 38.2%: 53.99
Daily Fibonacci 61.8%: 53.94
Daily Pivot Point S1: 53.86
Daily Pivot Point S2: 53.73
Daily Pivot Point S3: 53.61
Daily Pivot Point R1: 54.11
Daily Pivot Point R2: 54.23
Daily Pivot Point R3: 54.36
