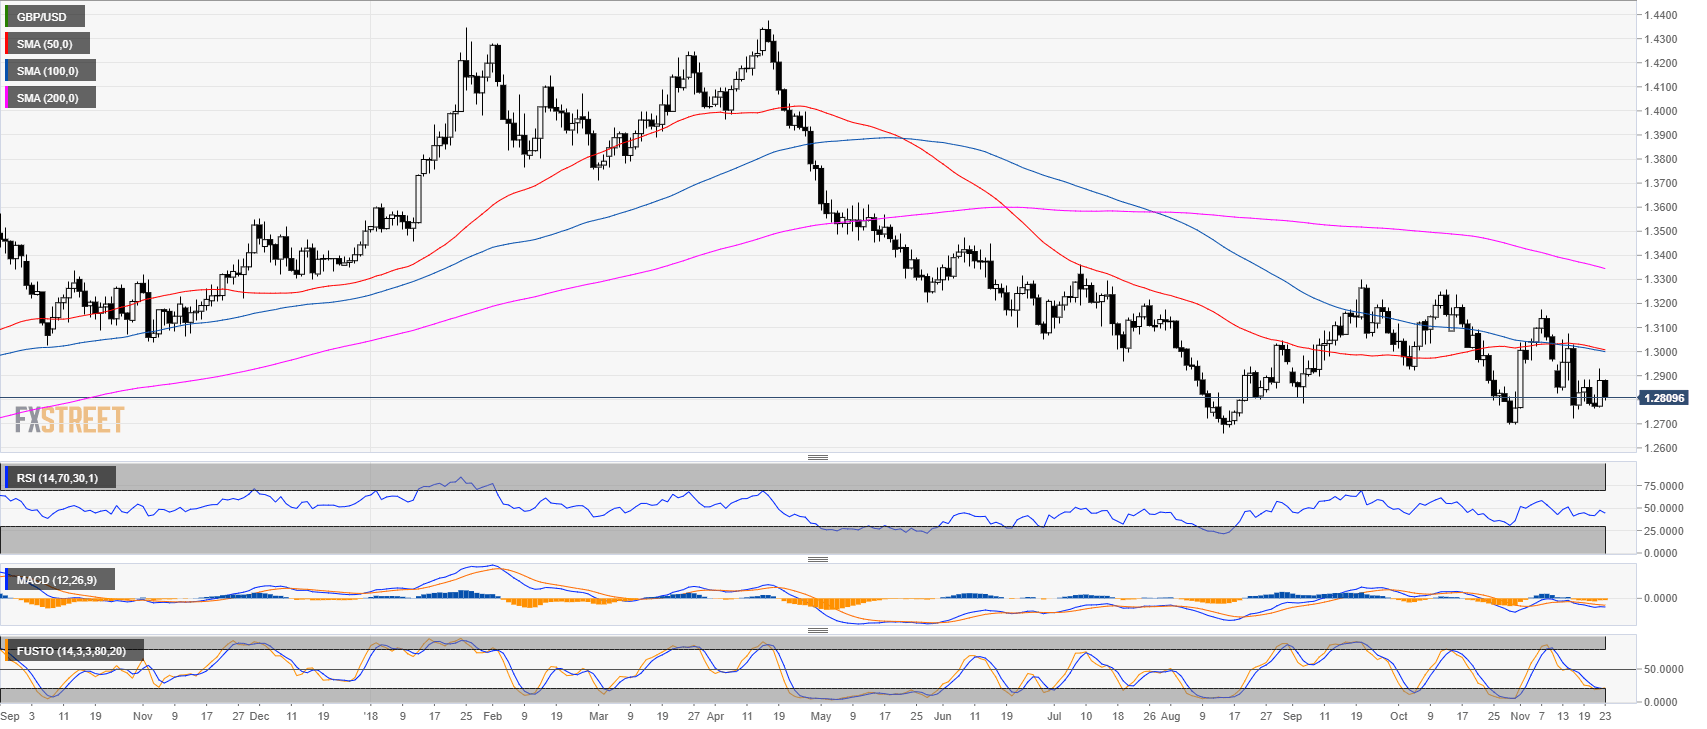
GBP/USD daily chart
- GBP/USD is trading in a bear trend below its major simple moving averages (SMAs).
- GBP/USD is trading close to the November lows as technical indicators remain weak.
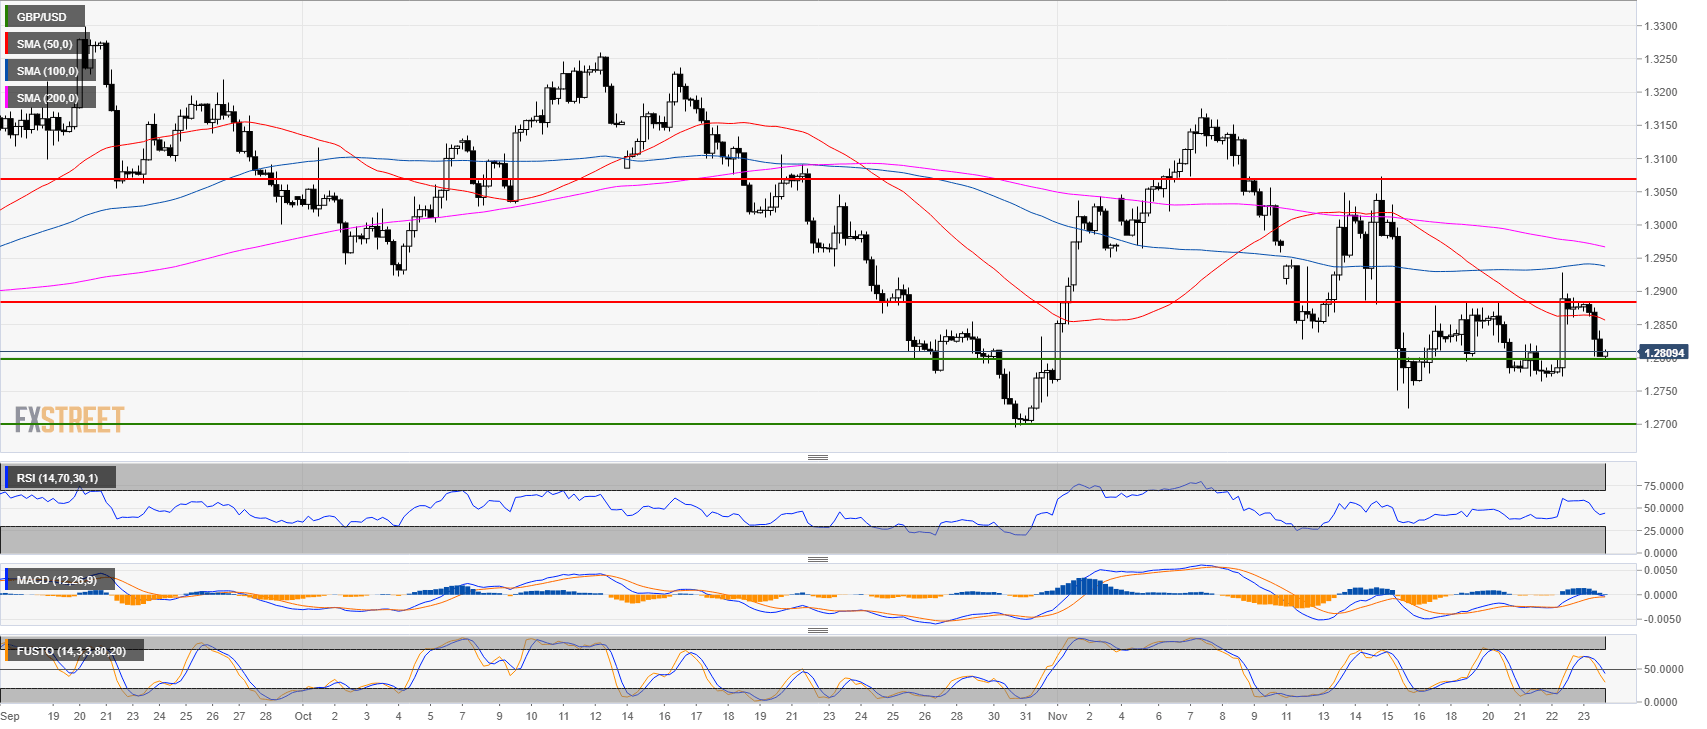
GBP/USD 4-hour chart
- GBP/USD is trading below its main SMAs while the RSI and Stochastic indicator are below the 50 lines. The MACD is weakening.
- Bears want a test of the November low at 1.2700 figure.
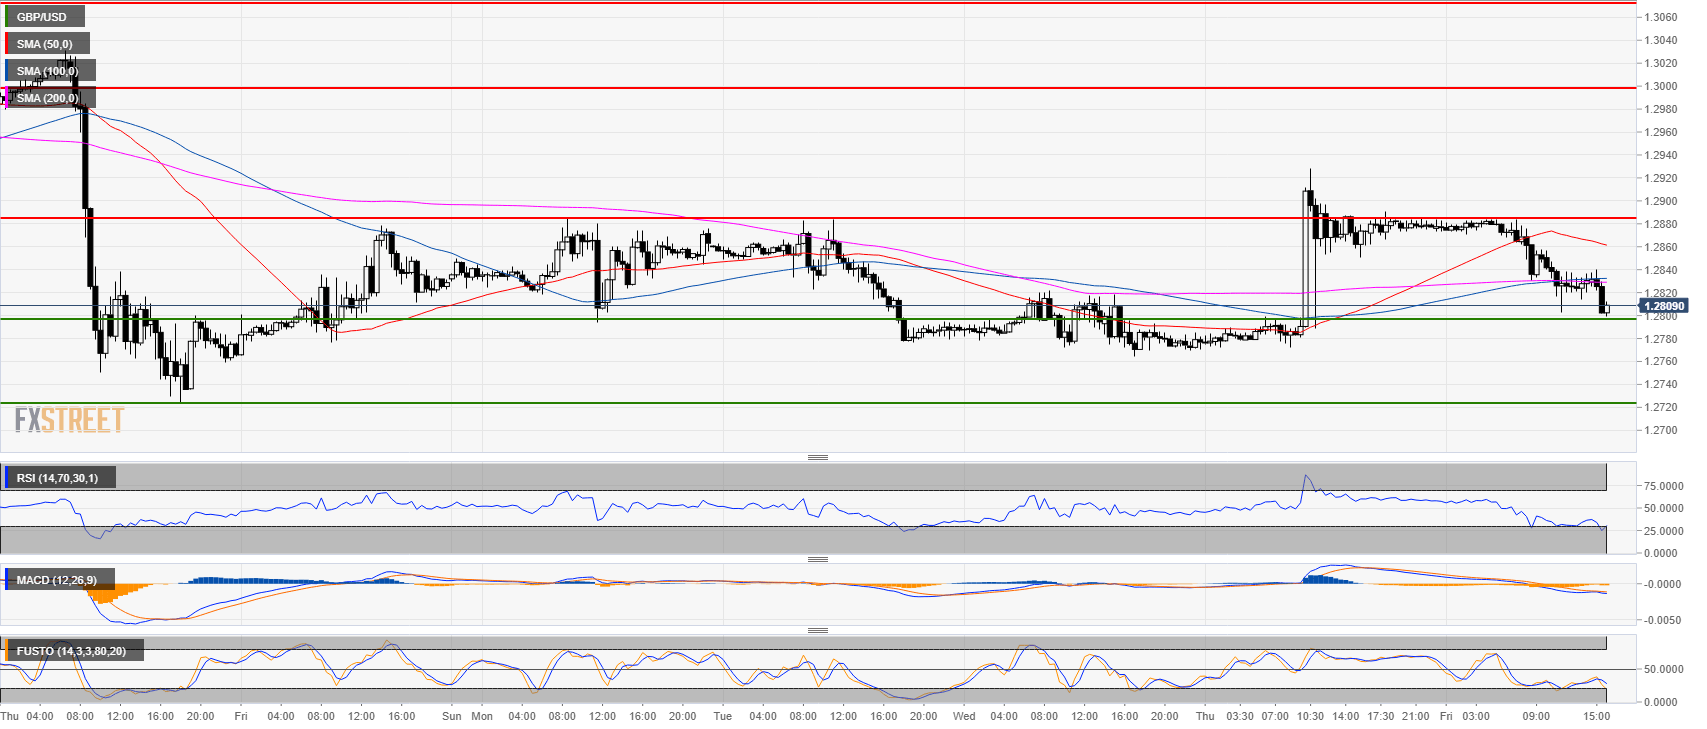
GBP/USD 30-minute chart
- GBP/USD found support just above the 1.2800 figure ad the market is trading below its main SMAs.
- Technical indicators are weak.
- A break of the 1.2800 level should lead to a drop to the 1.2720 level.
Additional key levels
GBP/USD
Overview:
Last Price: 1.2807
Daily change: -73 pips
Daily change: -0.567%
Daily Open: 1.288
Trends:
Daily SMA20: 1.2904
Daily SMA50: 1.3012
Daily SMA100: 1.3004
Daily SMA200: 1.3353
Levels:
Daily High: 1.2928
Daily Low: 1.277
Weekly High: 1.3074
Weekly Low: 1.2724
Monthly High: 1.326
Monthly Low: 1.2696
Daily Fibonacci 38.2%: 1.2868
Daily Fibonacci 61.8%: 1.283
Daily Pivot Point S1: 1.279
Daily Pivot Point S2: 1.2701
Daily Pivot Point S3: 1.2631
Daily Pivot Point R1: 1.2949
Daily Pivot Point R2: 1.3018
Daily Pivot Point R3: 1.3108
