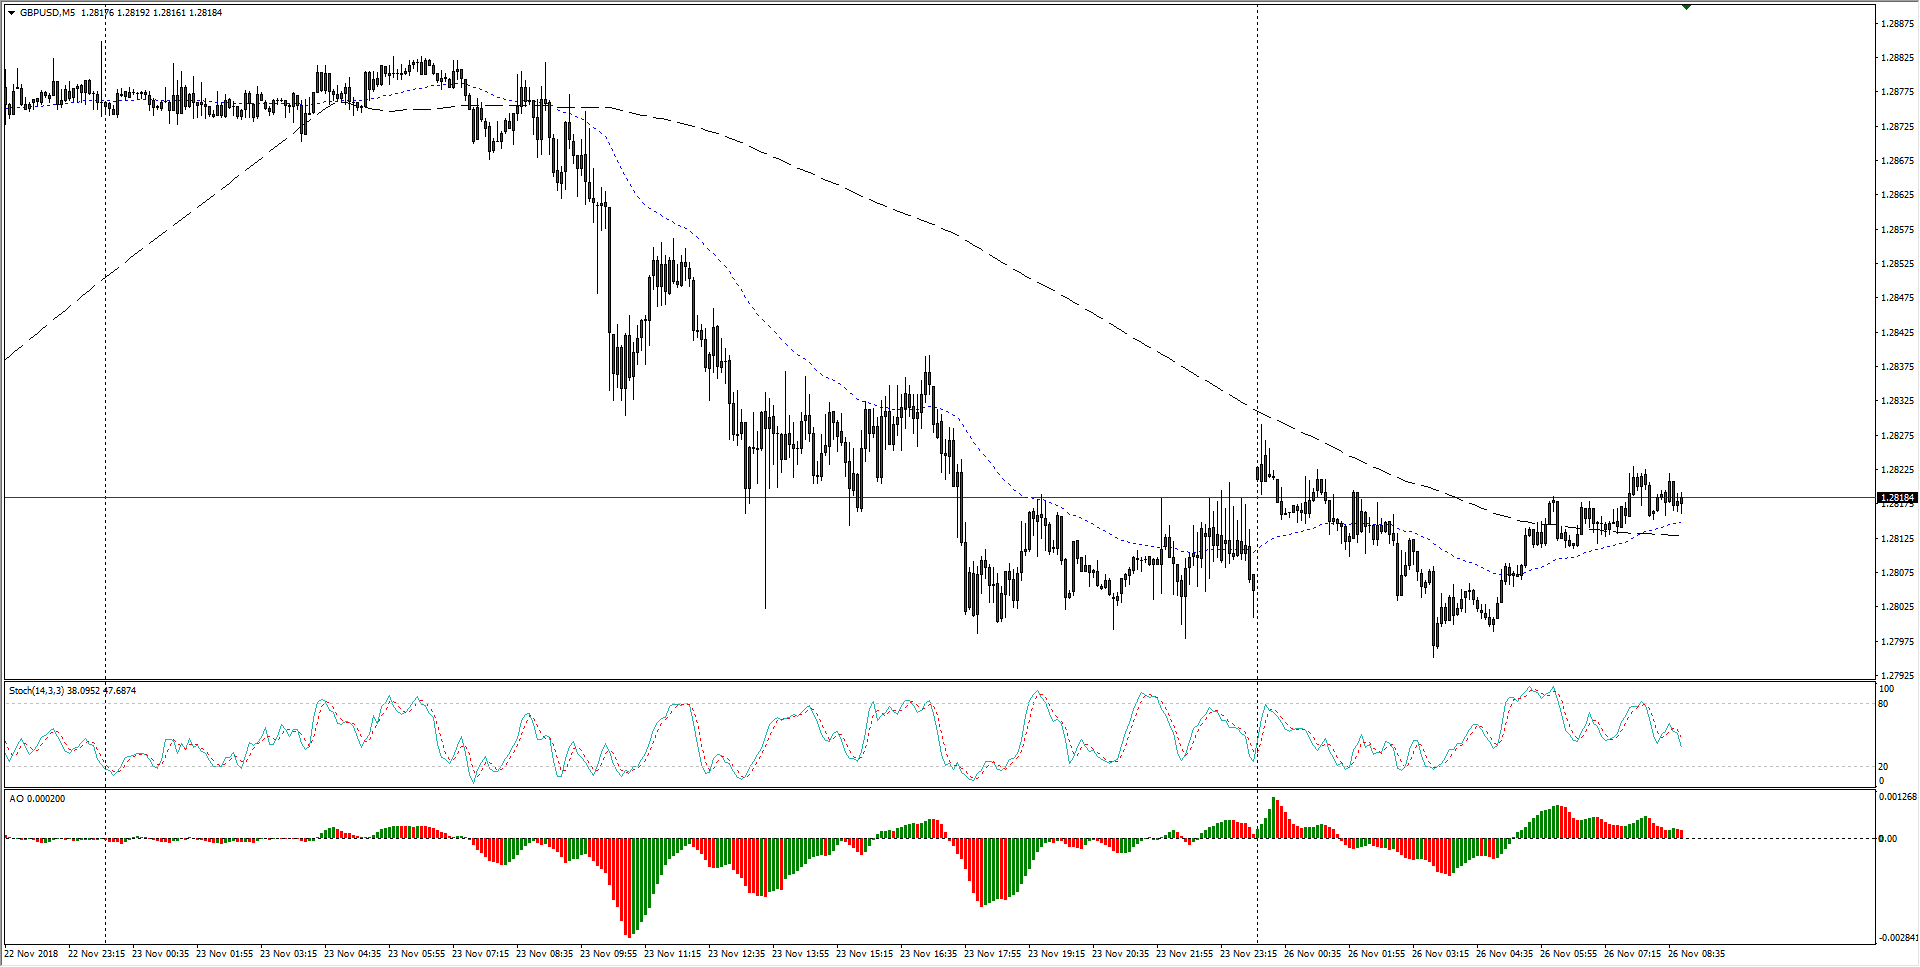
- The Sterling-Dollar pairing is seeing limited upside action, buoyed from near-term lows just below the 1.2800 major technical figure, but still in play within Monday’s early range after a thin bullish gap that failed to push the pair out of last Friday’s late-market consolidation range.
GBP/USD Chart, 5-Minute
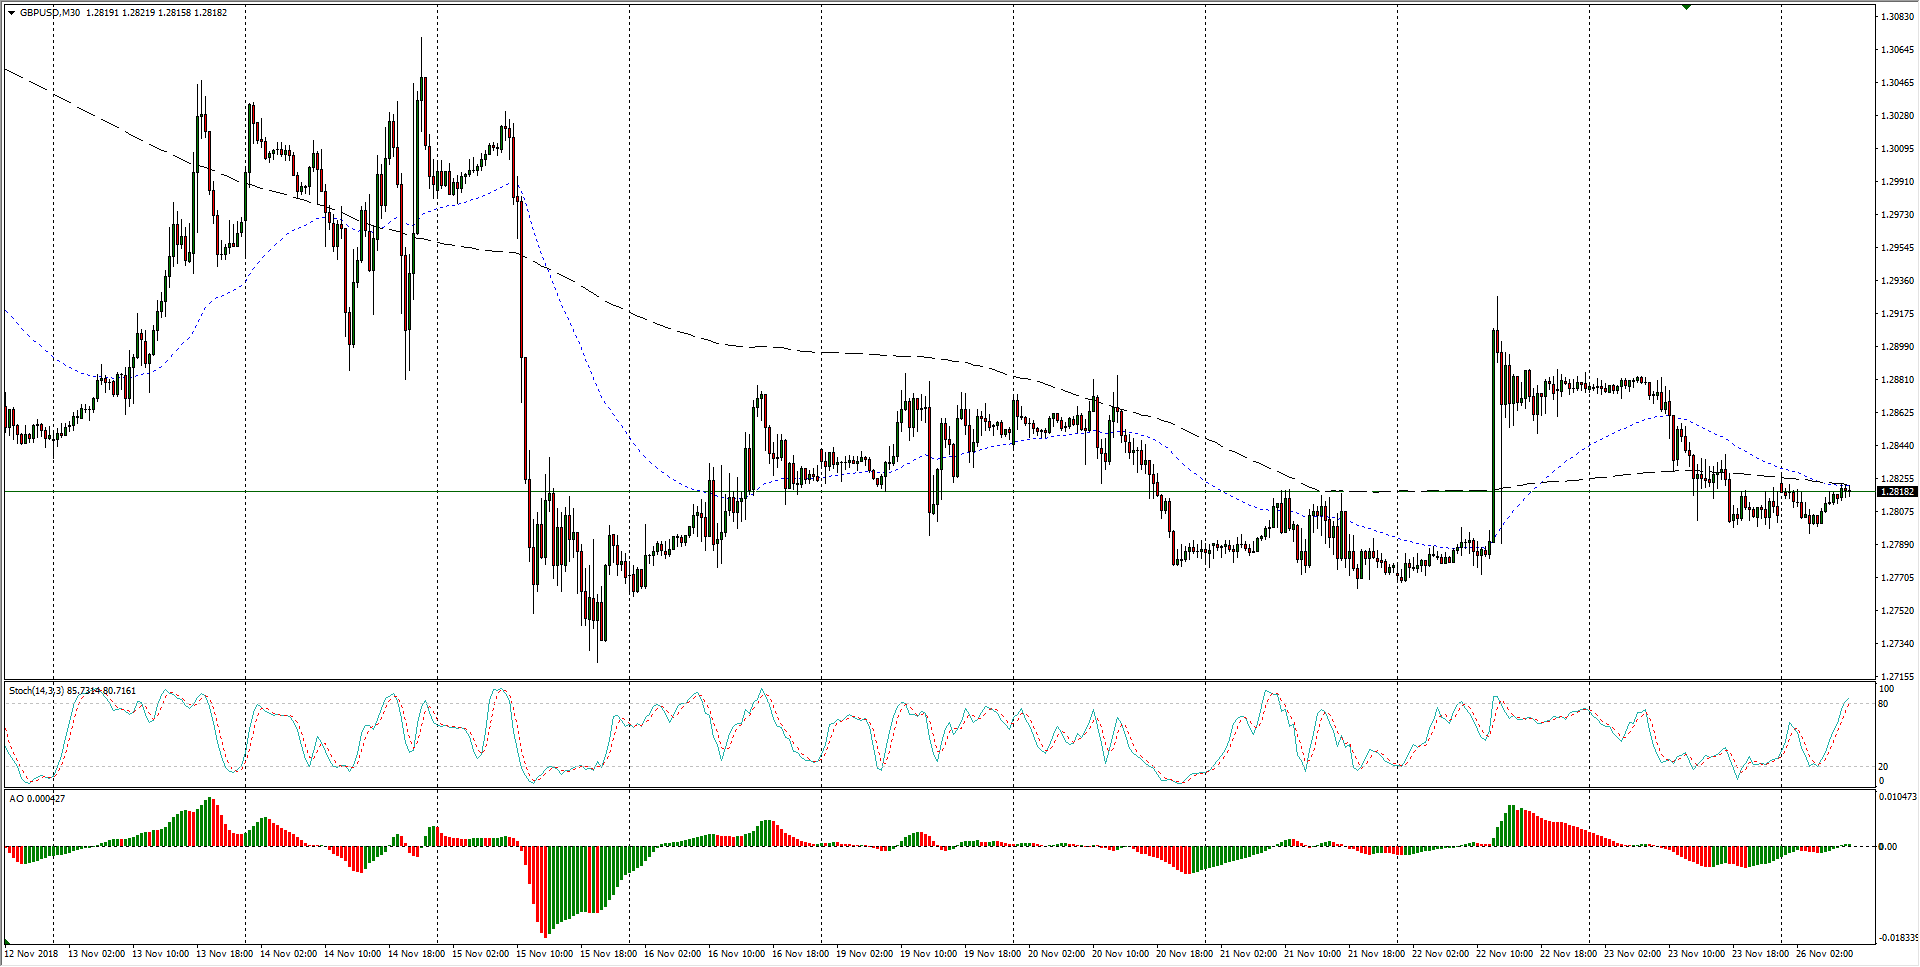
- Looking back over the past two weeks, the rise and fall of Brexit hopes throughout the broader market have had a profound effect on the Cable, leaving the major pairing in a lurching volatility trap where extreme swing points are predicated on broad-base buying or selling based on the flow of headlines surrounding the ongoing Brexit process, which shows little signs of letting up.
GBP/USD Chart, 30-Minute
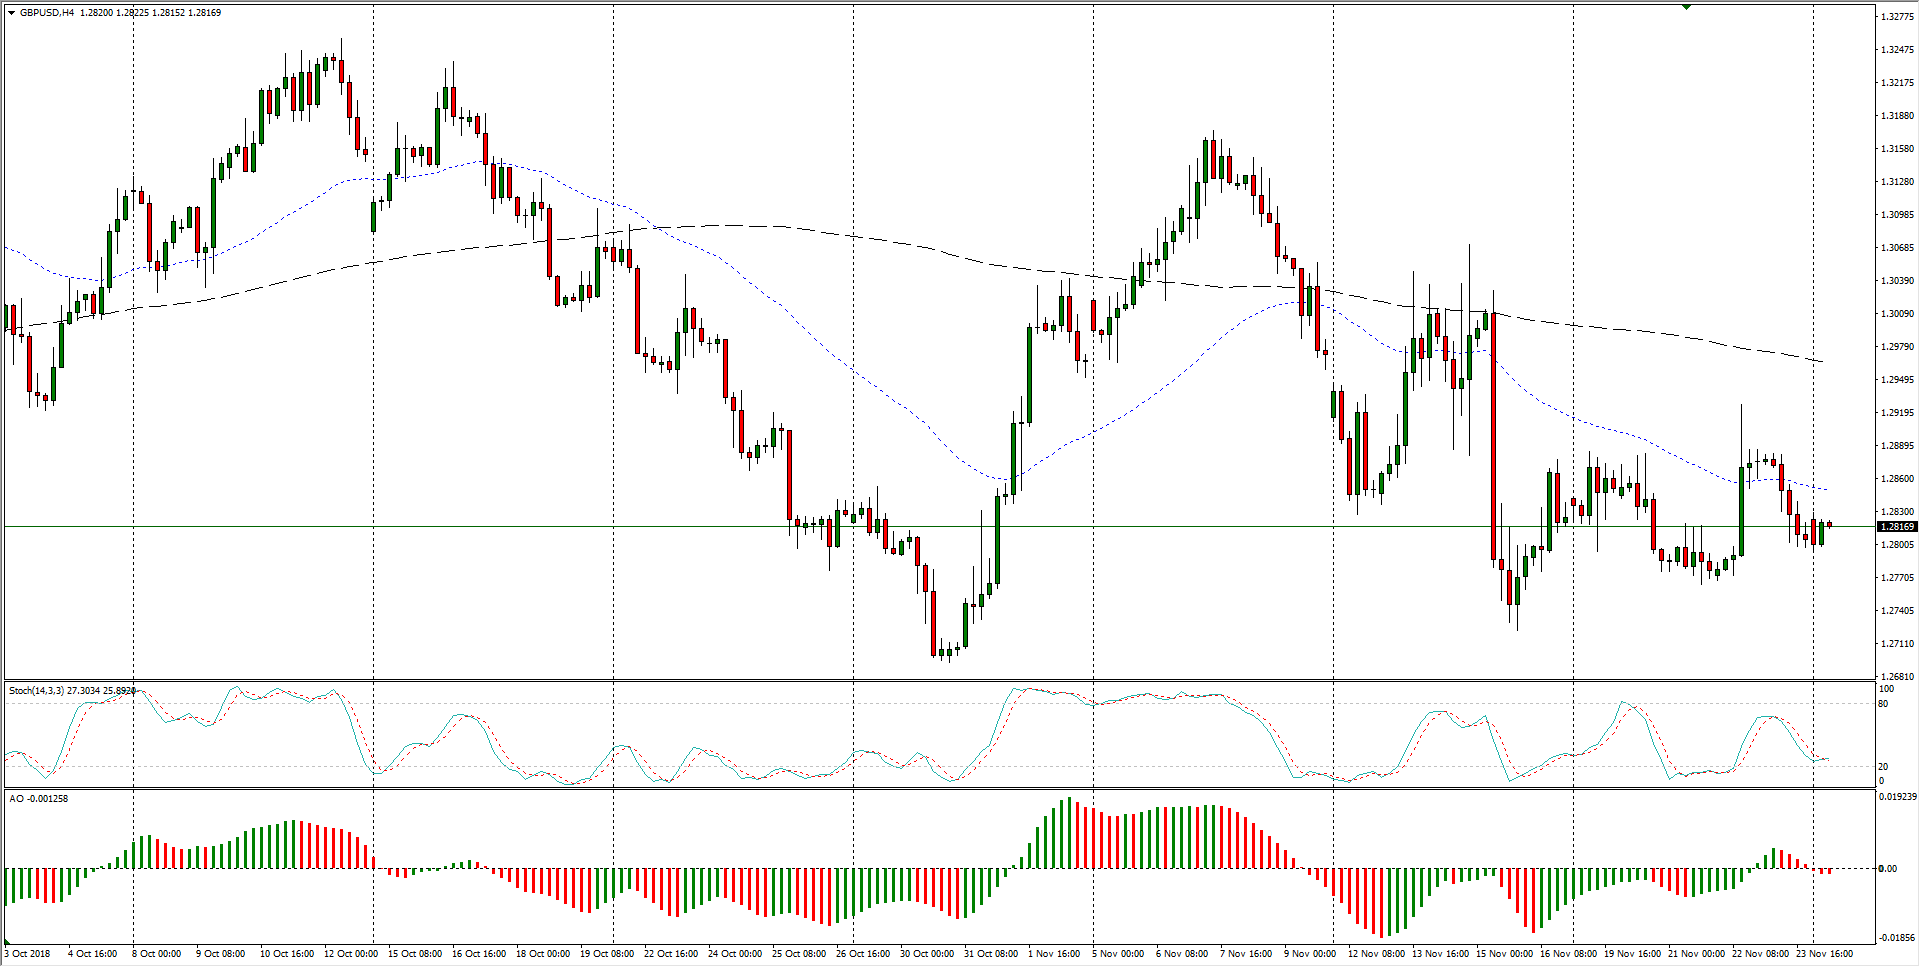
- Moving above the noise, the past two months sees the GBP/USD trapped in a tightening spiral, with lower highs and higher lows constraining the Cable as sideways volatility erases any medium-term trends.
GBP/USD Chart, 4-Hour
GBP/USD
Overview:
Today Last Price: 1.2818
Today Daily change: 3.0 pips
Today Daily change %: 0.0234%
Today Daily Open: 1.2815
Trends:
Previous Daily SMA20: 1.2904
Previous Daily SMA50: 1.3007
Previous Daily SMA100: 1.3
Previous Daily SMA200: 1.3347
Levels:
Previous Daily High: 1.2885
Previous Daily Low: 1.2799
Previous Weekly High: 1.2928
Previous Weekly Low: 1.2764
Previous Monthly High: 1.326
Previous Monthly Low: 1.2696
Previous Daily Fibonacci 38.2%: 1.2832
Previous Daily Fibonacci 61.8%: 1.2852
Previous Daily Pivot Point S1: 1.2781
Previous Daily Pivot Point S2: 1.2747
Previous Daily Pivot Point S3: 1.2695
Previous Daily Pivot Point R1: 1.2867
Previous Daily Pivot Point R2: 1.2919
Previous Daily Pivot Point R3: 1.2953
