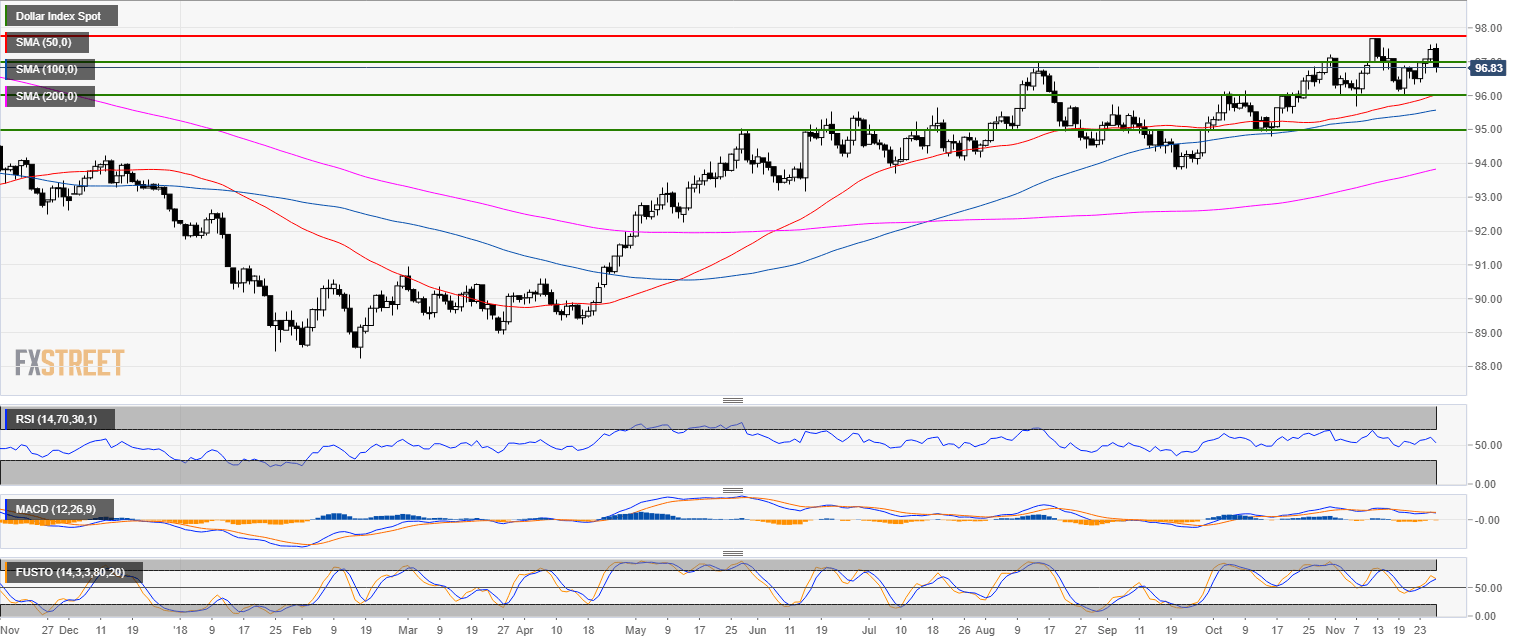
DXY daily chart
- The US Dollar Index (DXY) is trading in a bull trend above its main simple moving averages.
- Today’s down move was triggered by dovish comments from Fed’s Powell.
- Bears are set to close below the 97.00 psychological level as technical indicators are decelerating.
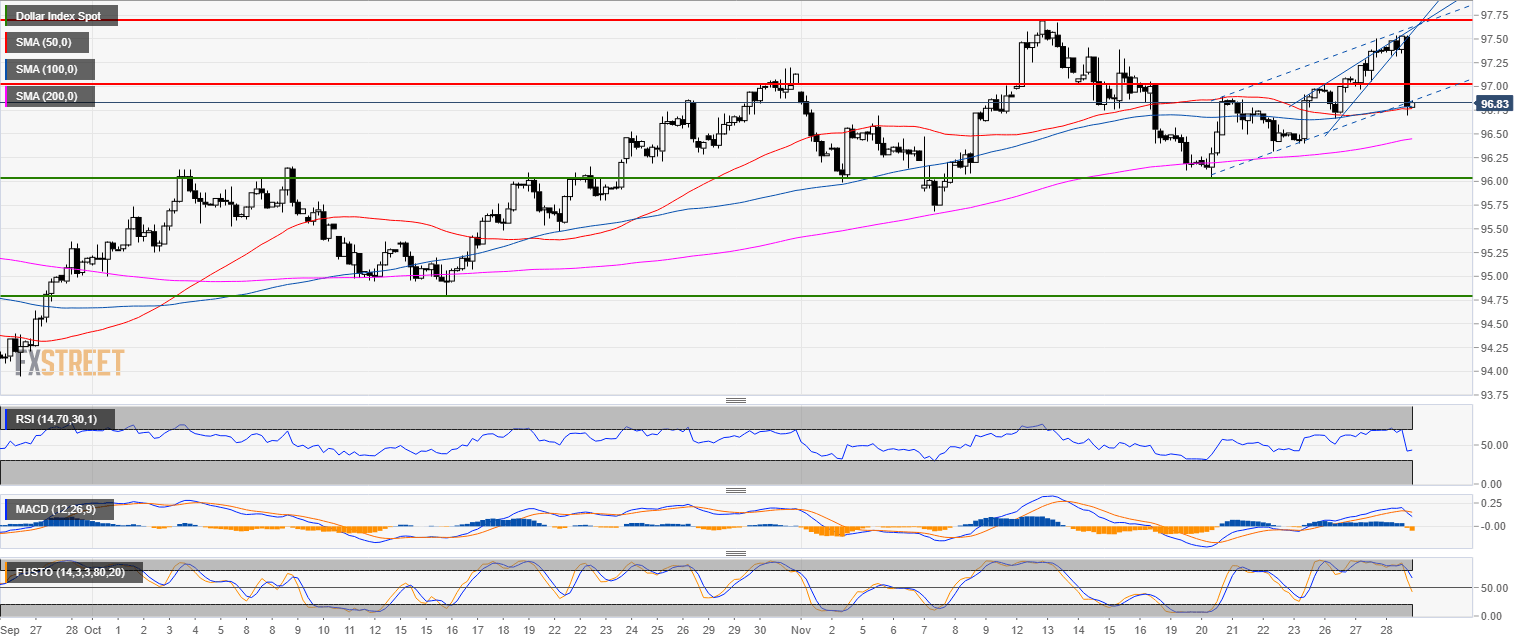
DXY 4-hour chart
- DXY plunged down to find some support at the 50 SMA.
- 97.00 and 97.25 become the new resistances.
- Technical indicators have turned bearish suggesting potential losses ahead.
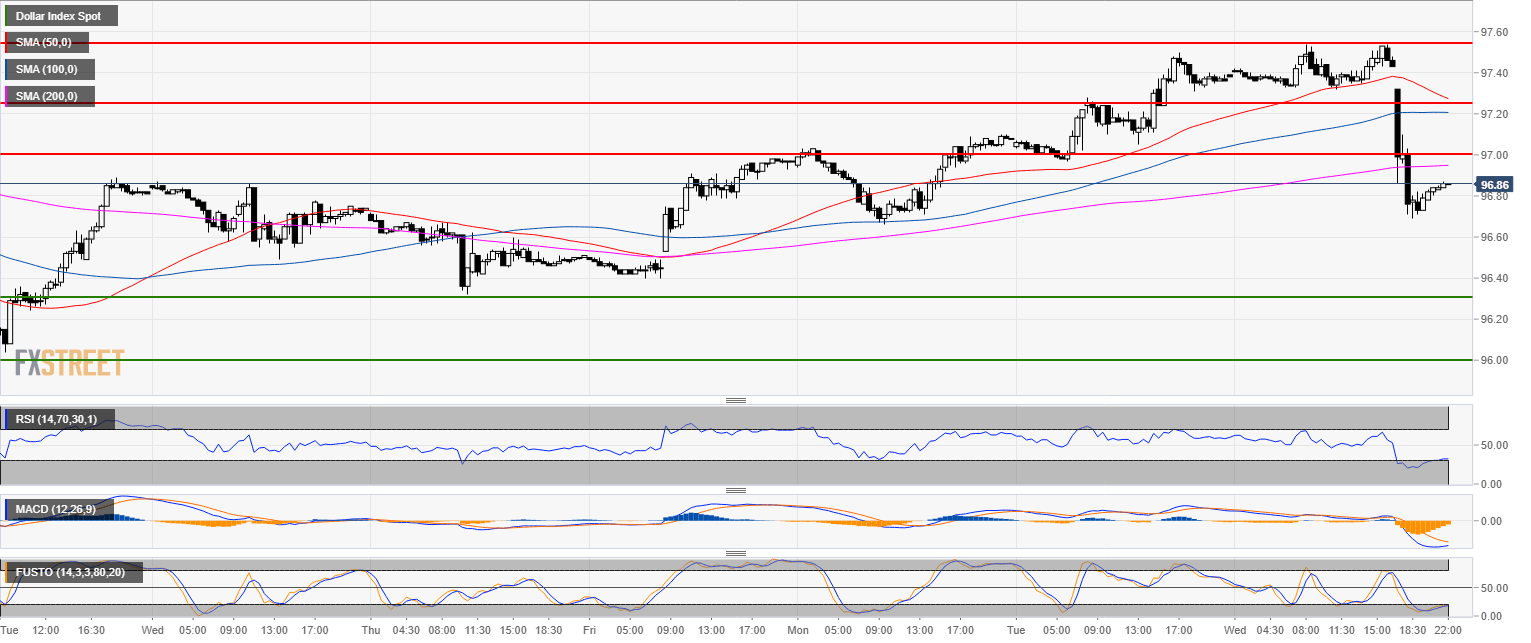
DXY 30-minute chart
- After the fresh sell-off, there can be a pullback up to 97.00 as the market might want to test the 200 SMA and the round number.
- If the bears keep the momentum going the next main target to the downside is likely located near the 96.30 level.
Additional key levels
Dollar Index Spot
Overview:
Today Last Price: 96.86
Today Daily change: -50 pips
Today Daily change %: -0.514%
Today Daily Open: 97.36
Trends:
Previous Daily SMA20: 96.76
Previous Daily SMA50: 95.98
Previous Daily SMA100: 95.55
Previous Daily SMA200: 93.79
Levels:
Previous Daily High: 97.5
Previous Daily Low: 96.97
Previous Weekly High: 96.98
Previous Weekly Low: 96.04
Previous Monthly High: 97.2
Previous Monthly Low: 94.79
Previous Daily Fibonacci 38.2%: 97.3
Previous Daily Fibonacci 61.8%: 97.17
Previous Daily Pivot Point S1: 97.05
Previous Daily Pivot Point S2: 96.75
Previous Daily Pivot Point S3: 96.52
Previous Daily Pivot Point R1: 97.58
Previous Daily Pivot Point R2: 97.81
Previous Daily Pivot Point R3: 98.11
