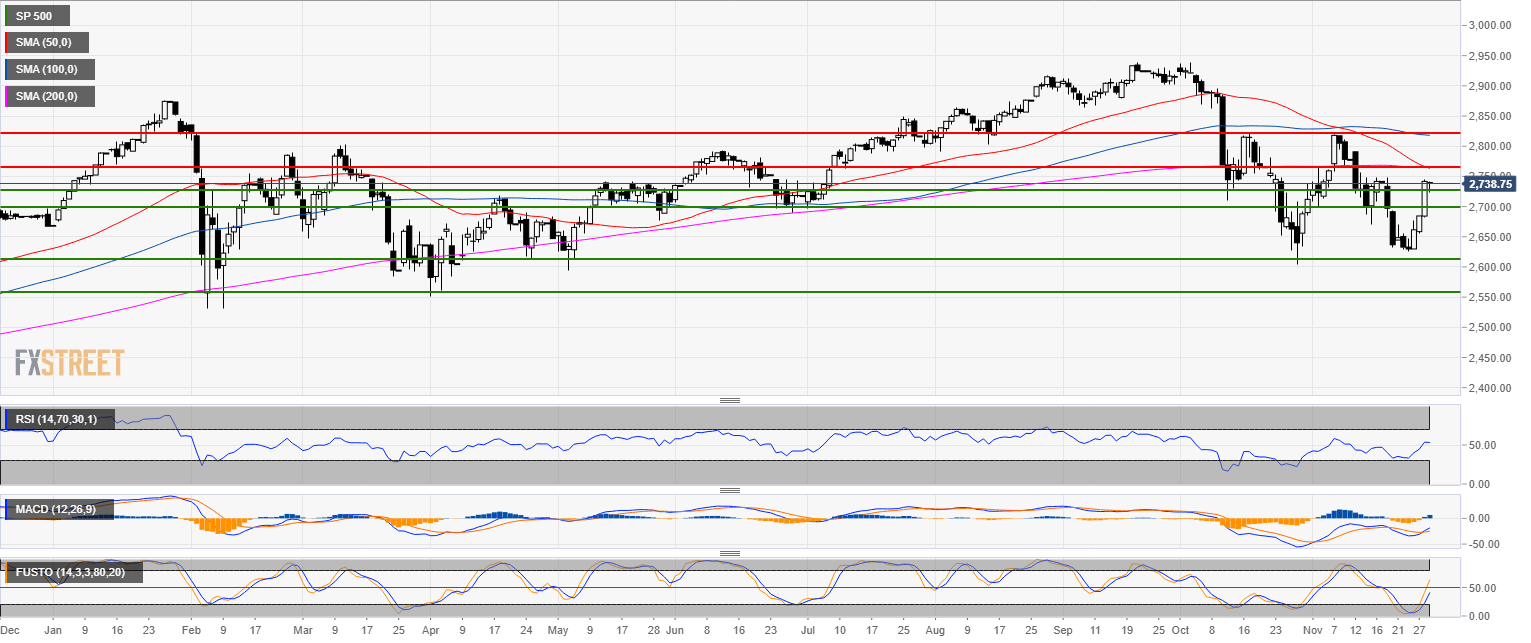
S&P500 daily chart
- The S&P500 is trading in a bear trend below its 200-day simple moving average.
- The S&P500 is rebounding nicely from the double bottom formation. The 2,735,00 target has been achieved. Now bulls are looking at the 2,770.00 and 2,818.75 levels.
- Technical indicators are bullish, further confirming the bullish current bullish bias.
Additional key levels
SP 500
Overview:
Today Last Price: 2737.25
Today Daily change: -4.5e+2 pips
Today Daily change %: -0.164%
Today Daily Open: 2741.75
Trends:
Previous Daily SMA20: 2719.52
Previous Daily SMA50: 2766.58
Previous Daily SMA100: 2818.82
Previous Daily SMA200: 2764.88
Levels:
Previous Daily High: 2745.25
Previous Daily Low: 2681.75
Previous Weekly High: 2747.5
Previous Weekly Low: 2626
Previous Monthly High: 2939.5
Previous Monthly Low: 2604.5
Previous Daily Fibonacci 38.2%: 2720.99
Previous Daily Fibonacci 61.8%: 2706.01
Previous Daily Pivot Point S1: 2700.58
Previous Daily Pivot Point S2: 2659.42
Previous Daily Pivot Point S3: 2637.08
Previous Daily Pivot Point R1: 2764.08
Previous Daily Pivot Point R2: 2786.42
Previous Daily Pivot Point R3: 2827.58
