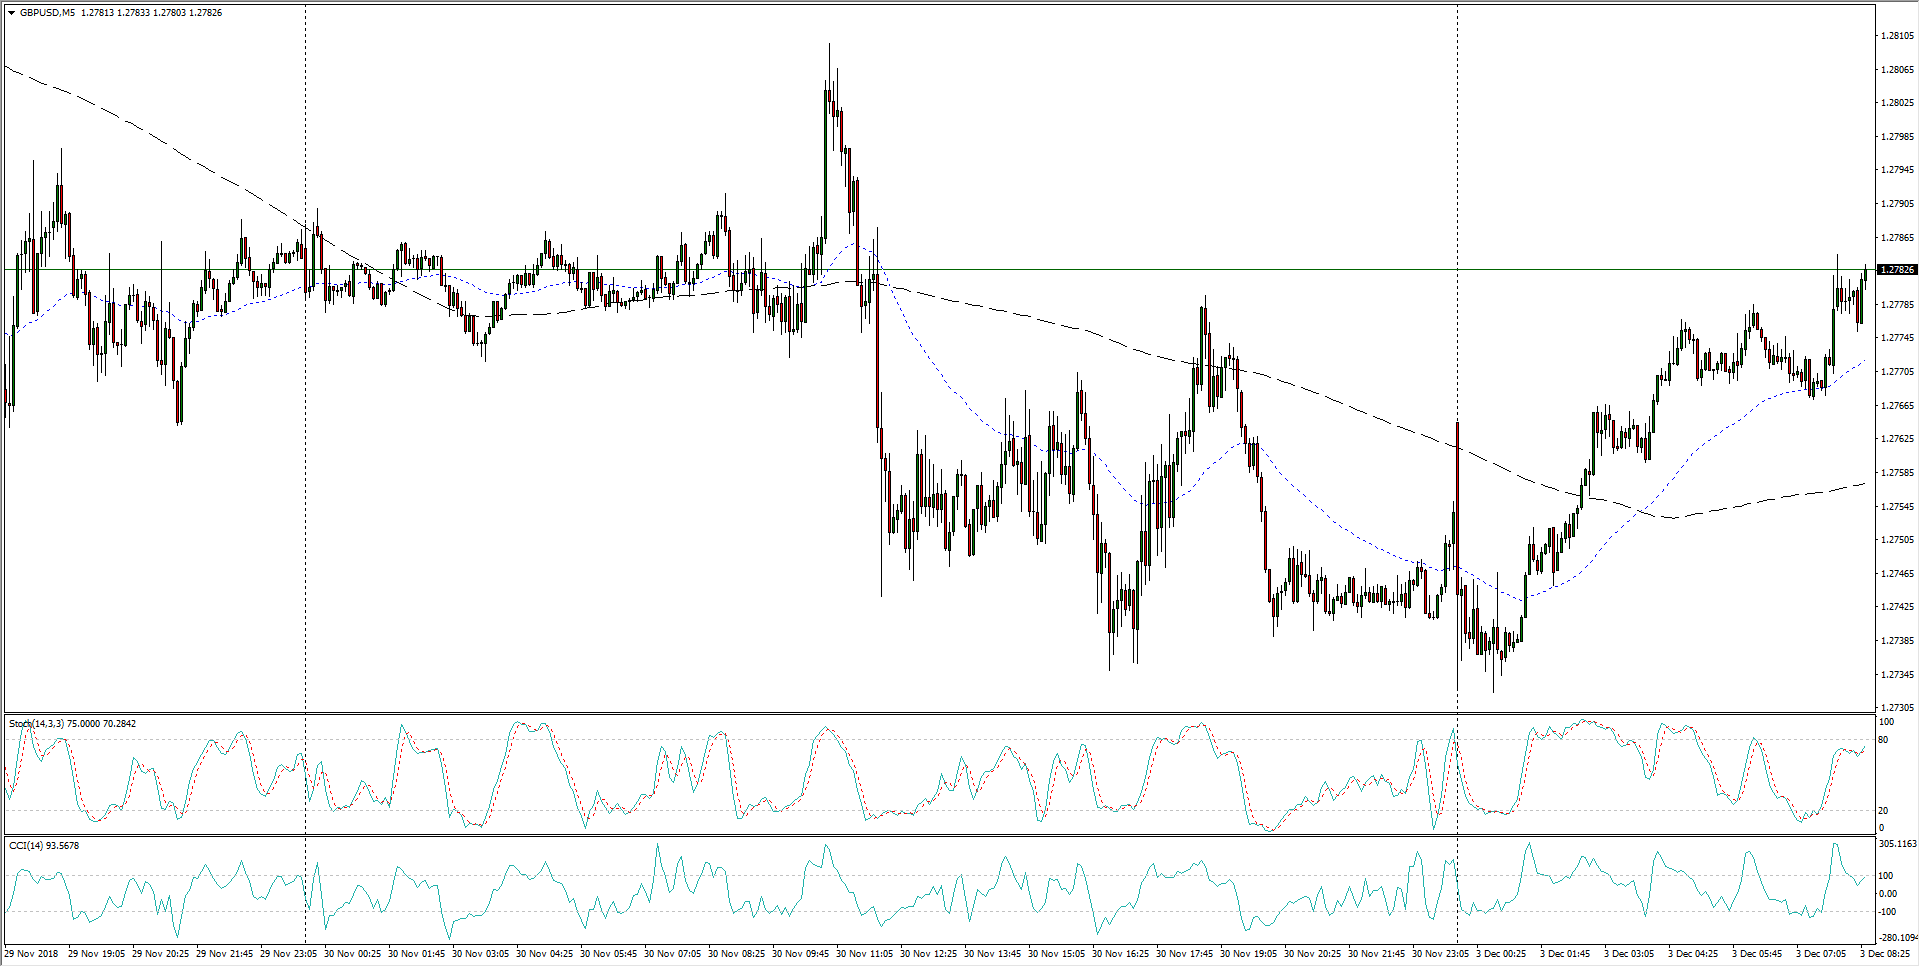
- GBP/USD sees lift in early Monday action, propped up to 1.2780 after some rough opening action near 1.2730, but tight action remains a challenge near Friday’s consolidation range.
GBP/USD, 5-Minute
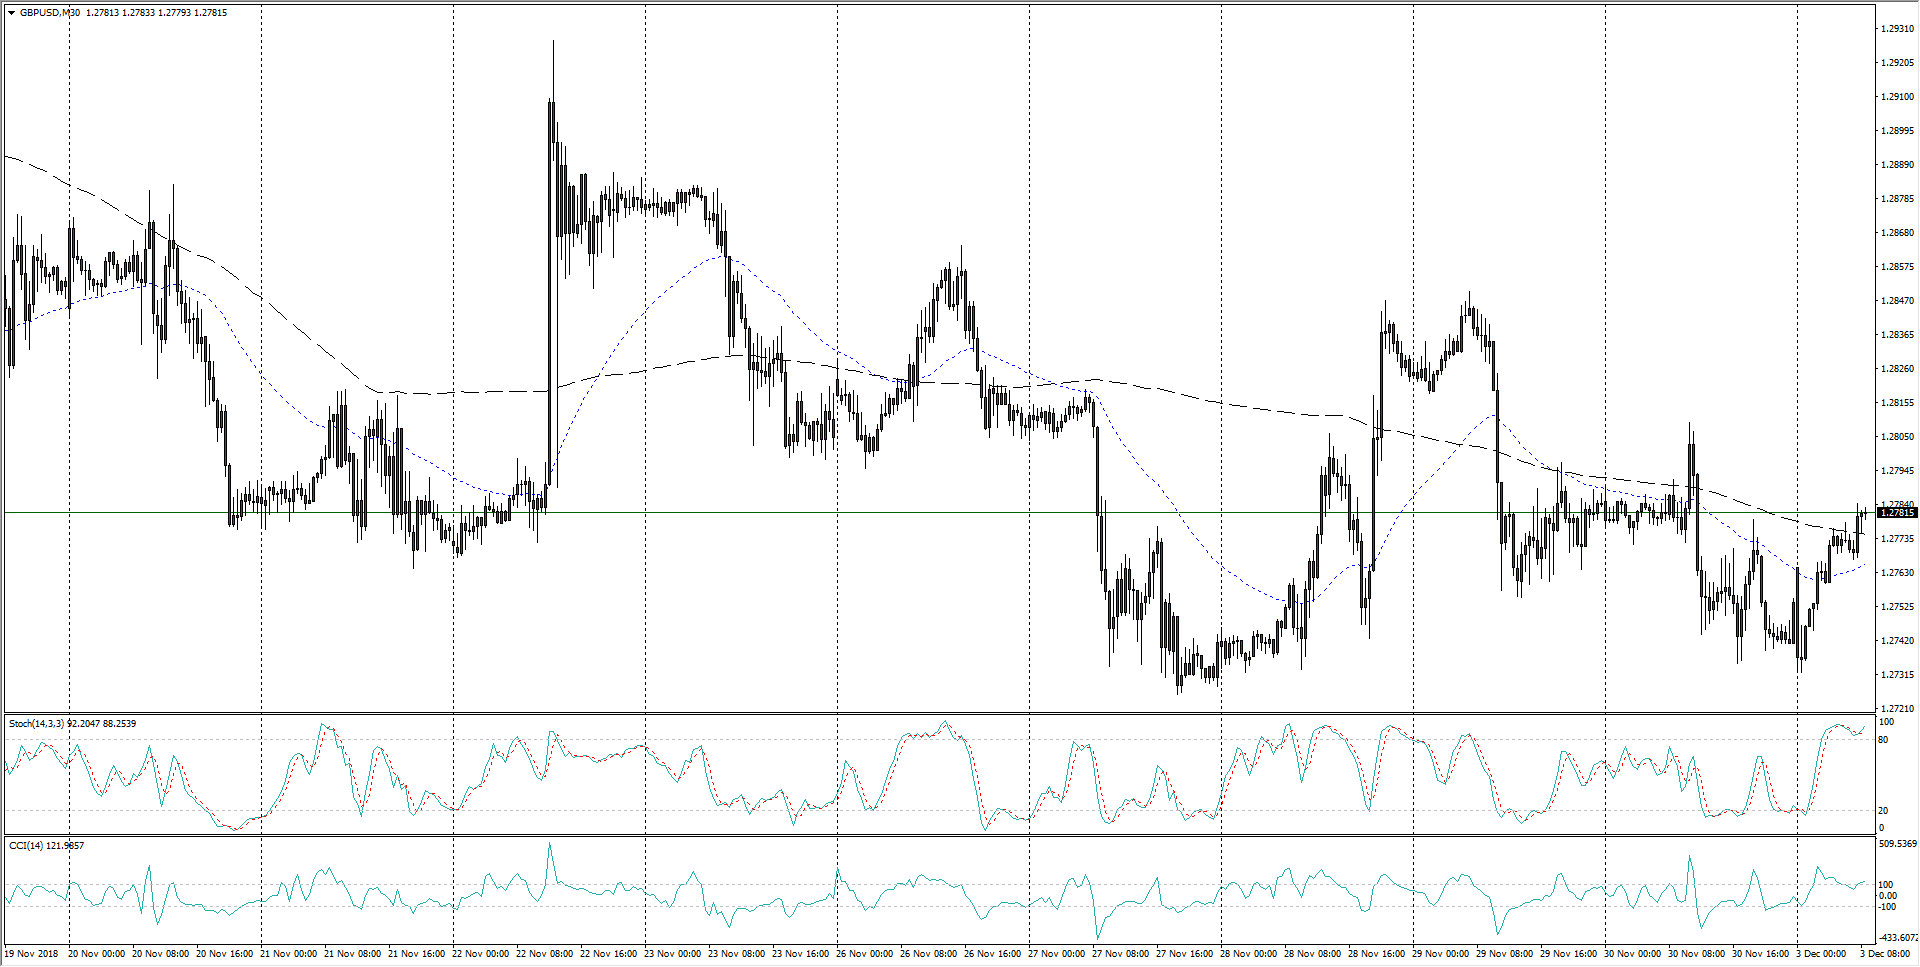
- The past two weeks show limited potential for a near-term upmove, with resistance built in from sequential lower highs and a roughly declining support base, and moves beyond the 200-period moving average struggle to maintain momentum.
GBP/USD, 30-Minute
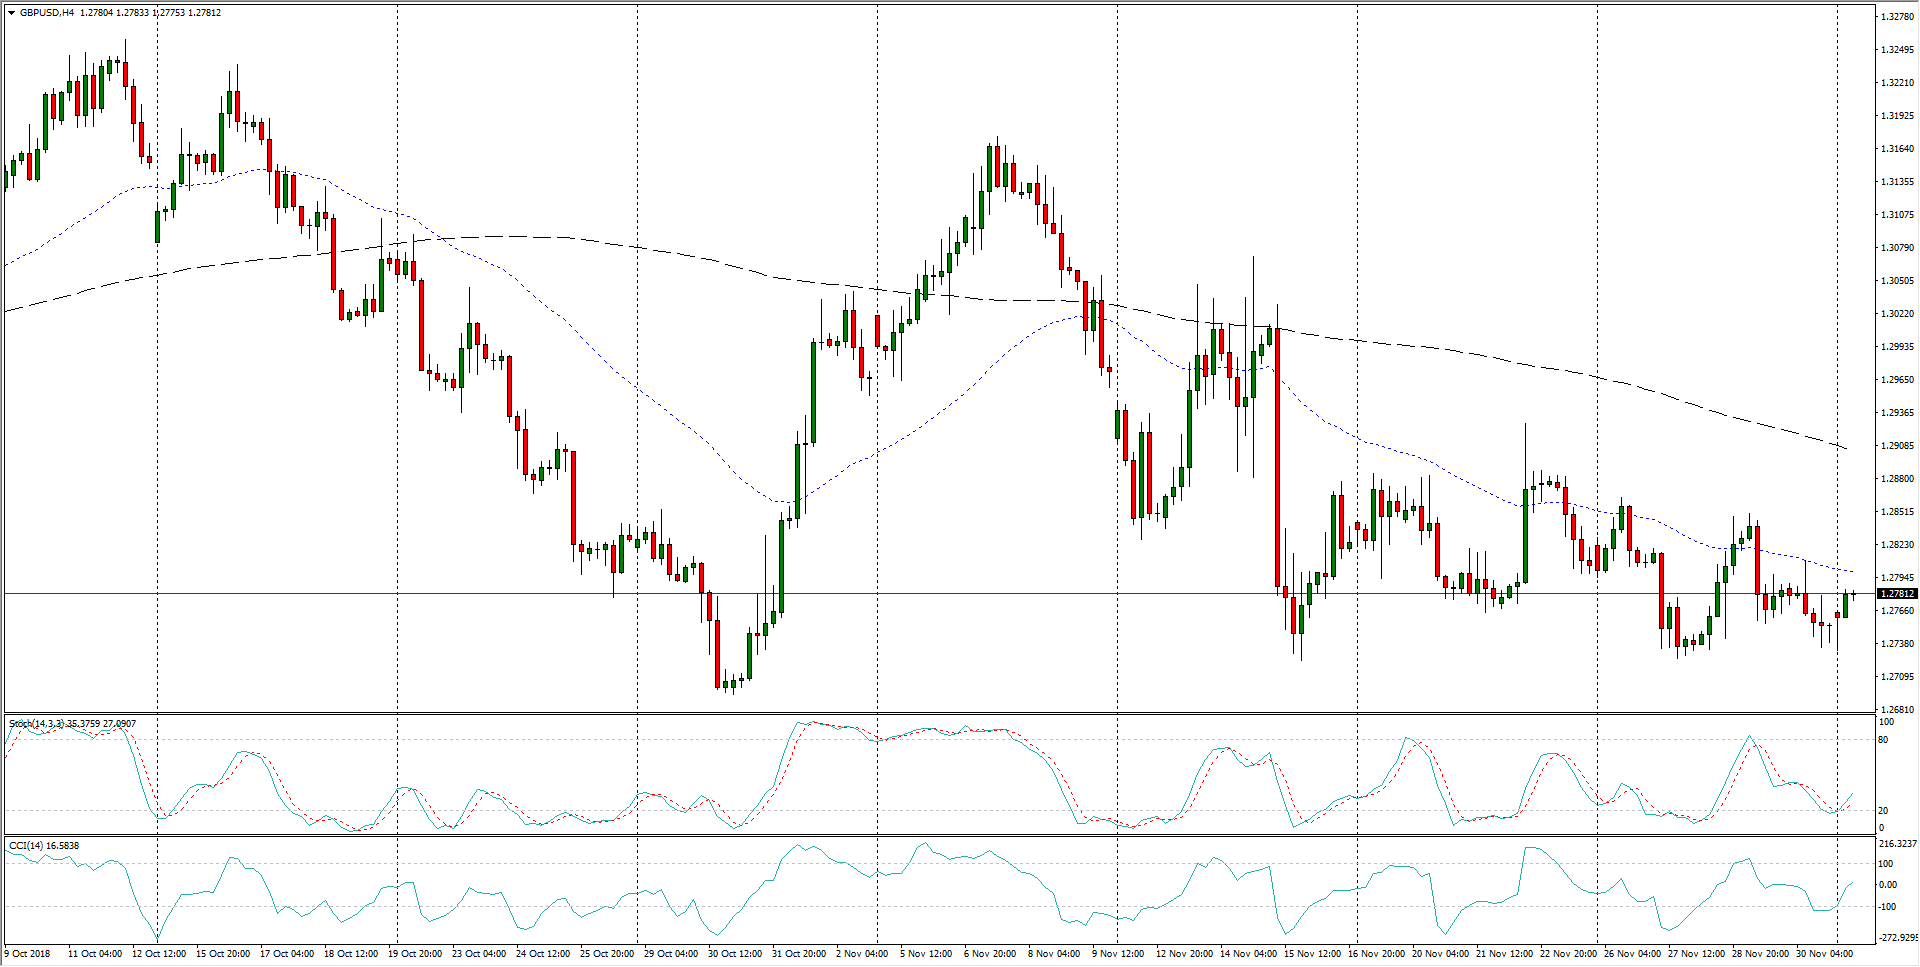
- The Sterling’s 4-Hour candle chart looks increasingly like a bearish snap is being built into the current mid-term trend, with continued downside pressure keeping buyers capped off with near-term resistance from the 50-period moving average.
GBP/USD, 4-Hour
GBP/USD
Overview:
Today Last Price: 1.2781
Today Daily change: 38 pips
Today Daily change %: 0.298%
Today Daily Open: 1.2743
Trends:
Previous Daily SMA20: 1.2887
Previous Daily SMA50: 1.2969
Previous Daily SMA100: 1.2977
Previous Daily SMA200: 1.3317
Levels:
Previous Daily High: 1.281
Previous Daily Low: 1.2735
Previous Weekly High: 1.2864
Previous Weekly Low: 1.2725
Previous Monthly High: 1.3176
Previous Monthly Low: 1.2723
Previous Daily Fibonacci 38.2%: 1.2764
Previous Daily Fibonacci 61.8%: 1.2781
Previous Daily Pivot Point S1: 1.2715
Previous Daily Pivot Point S2: 1.2688
Previous Daily Pivot Point S3: 1.264
Previous Daily Pivot Point R1: 1.279
Previous Daily Pivot Point R2: 1.2837
Previous Daily Pivot Point R3: 1.2865
