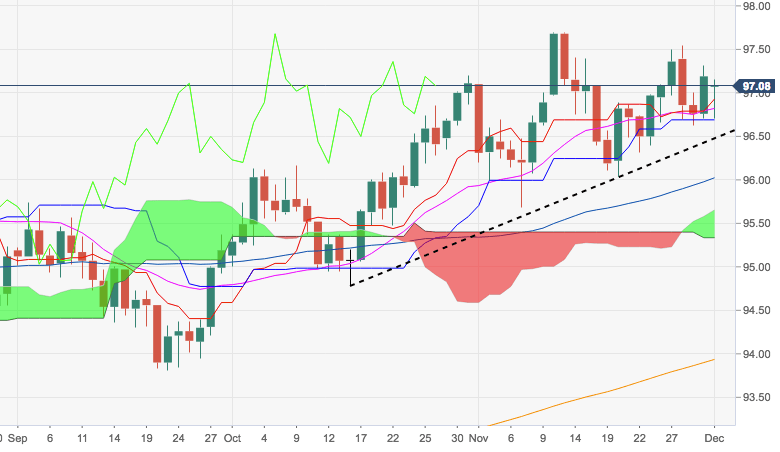
- The index has managed to regains the 97.00 handle and above on Monday after bottoming out in the 96.70 region earlier in the day.
- The constructive bias in the buck remains underpinned by the short-term support line, today at 96.47, and therefore keeps targeting YTD peaks near 97.70 (November 12).
- Below this key area aligns the 55-day SMA at 96.00, coincident with mid-November lows and a Fibo retracement of the 2017-2018 drop.
DXY daily chart
Dollar Index Spot
Overview:
Today Last Price: 97.07
Today Daily change: -12 pips
Today Daily change %: -0.123%
Today Daily Open: 97.19
Trends:
Previous Daily SMA20: 96.81
Previous Daily SMA50: 96.14
Previous Daily SMA100: 95.61
Previous Daily SMA200: 93.9
Levels:
Previous Daily High: 97.31
Previous Daily Low: 96.71
Previous Weekly High: 97.54
Previous Weekly Low: 96.62
Previous Monthly High: 97.7
Previous Monthly Low: 95.68
Previous Daily Fibonacci 38.2%: 97.08
Previous Daily Fibonacci 61.8%: 96.94
Previous Daily Pivot Point S1: 96.83
Previous Daily Pivot Point S2: 96.47
Previous Daily Pivot Point S3: 96.23
Previous Daily Pivot Point R1: 97.43
Previous Daily Pivot Point R2: 97.67
Previous Daily Pivot Point R3: 98.03
