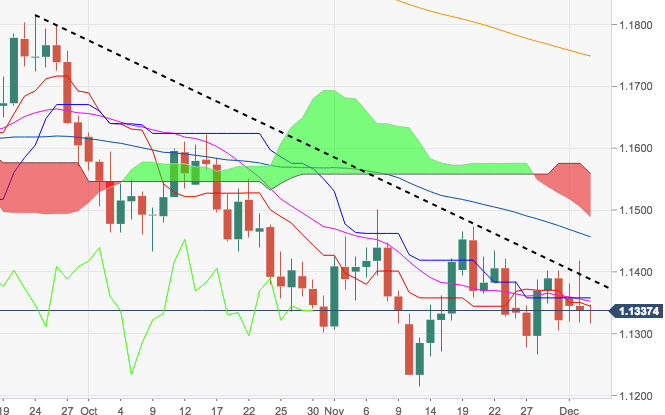
- The pair has once again failed to sustain a breakout of the critical barrier at 1.1400 the figure, sparking instead a moderate sell off to the 1.1320 region.
- That said, the door remains well open for another test of the 1.1300 neighbourhood, where sits recent lows.
- Further south emerges the 2018 low at 1.1214 (November 12) ahead of 1.1188, a Fibo retracement of the 2017-2018 rally.
EUR/USD daily chart
EUR/USD
Overview:
Today Last Price: 1.1338
Today Daily change: 0.0 pips
Today Daily change %: 0.00%
Today Daily Open: 1.1338
Trends:
Previous Daily SMA20: 1.1353
Previous Daily SMA50: 1.1434
Previous Daily SMA100: 1.1523
Previous Daily SMA200: 1.1755
Levels:
Previous Daily High: 1.1419
Previous Daily Low: 1.1318
Previous Weekly High: 1.1402
Previous Weekly Low: 1.1267
Previous Monthly High: 1.15
Previous Monthly Low: 1.1216
Previous Daily Fibonacci 38.2%: 1.1357
Previous Daily Fibonacci 61.8%: 1.138
Previous Daily Pivot Point S1: 1.1298
Previous Daily Pivot Point S2: 1.1258
Previous Daily Pivot Point S3: 1.1197
Previous Daily Pivot Point R1: 1.1398
Previous Daily Pivot Point R2: 1.1459
Previous Daily Pivot Point R3: 1.1499
